Protective Relay Training - Basic
Our customized live online or in‑person group training can be delivered to your staff at your location.

- Live Online
- 12 hours Instructor-led
- Group Training Available
Regular Price:
$699
Coupon Price:
$599
4Energy biocoal expansion plans target renewable energy growth via biocoal production from waste wood, biomass power generation, and international sites in Brazil, Belgium, Germany, and the UK, supporting carbon-neutral decarbonization and investor optimism.
The Latest Developments
4Energy's global rollout of biocoal and biomass power to expand renewable energy across new sites in Europe and Brazil.
- Office in Brazil; sites in Ham (BE), Germany, UK
- Amel plant: waste wood power plus biocoal unit
- EBITDA down in 2009; H2 2010 seen up ~10%
- First-mover visibility; global inquiries incl. New Zealand
- Biocoal claimed CO2-neutral via replanting cycle
Belgian biocoal maker 4Energy Invest expects earnings to rise 10 percent in the second half of 2010, and sees sales up tenfold within four years on a surge in demand for the CO2neutral fuel.
The firm, which makes electricity and biocoal by burning waste wood, is planning a major international expansion and has opened an office in Brazil, is building a site in Ham, Belgium, where Belgian biomass generators continue to secure fuel pellets, and is looking at sites in Germany and the UK.
Turnover we should reach it multiplied by 10 within three to four years, Chief Executive Yves Crits told Reuters during an interview at its main power plant in Amel, on the border between Germany and Belgium.
4Energy floated in 2008 at just over 6 euros and peaked later that year at just over 7 euros before falling in the recession. While trading around 5 euros for most of this year, it should post further gains on the expansion plan.
What we have done is to anticipate the roll out of the technology, as utilities convert Danish power plants for biomass feed, by already introducing the permit file in Ham, the permit file in Germany, by already creating the office in Brazil, by having negotiation with groups in other parts of the world, he said.
The company began life in 2005 producing energy for the wood industry in the forests around Amel, but its role as a biocoal pioneer resulted in it being approached to set up biomass plants in countries as far afield as Brazil and New Zealand.
We were contacted by people in New Zealand, they contact us. As the first mover we have enjoyed high visibility and we want to keep this first mover advantage, said Crits.
Earnings before interest, tax, depreciation and amortization EBITDA tumbled to 2.8 million euros US $3.78 million in 2009 compared with 4.3 million in the previous year, hit by falling energy prices.
However, Crits predicted that EBITDA would rise by about 10 percent in the second half of 2010 as prices recovered.
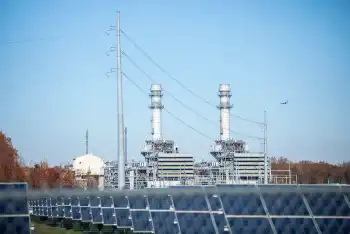
The Amel plant combines an electricity generator powered by waste wood, a form of wood-fueled power, and a unit which super heats the wood to create biocoal, which the company then sells to be burned by power stations.
However, many of the new sites could focus on making biocoal, as coal plants look to biomass to cut emissions, with a waste wood generator used mainly to give the plant electricity.
You cut the tree to make the biocoal, you replant it, and basically you dont increase the volume of CO2, thats the reason why the biocoal is CO2 neutral, said Crits.
Related News
Related News
More Polar Vortex 2021 Fallout (and Texas Two-Step): Monitor For ERCOT Identifies Improper Payments For Ancillary Services
ERCOT Ancillary Services Clawback and VOLL Pricing summarize PUCT and IMM actions on load shed,…
View more
Pennsylvania residents could see electricity prices rise as much as 50 percent this winter
Pennsylvania Electric Rate Increases hit Peco, PPL, and Pike County, driven by natural gas costs…
View more
California electricity pricing changes pose an existential threat to residential rooftop solar
California Rooftop Solar Rate Reforms propose shifting net metering to fixed access fees, peak-demand charges,…
View more

Hydro One’s takeover of U.S. utility sparks customer backlash: ‘This is an incredibly bad idea’
Hydro One-Avista acquisition sparks Idaho regulatory scrutiny over foreign ownership, utility merger impacts, rate credits,…
View more
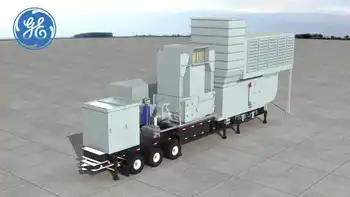
USAID Delivers Mobile Gas Turbine Power Plant to Ukraine
USAID GE Mobile Power Plant Ukraine supplies 28MW of emergency power and distributed generation to…
View more

Energize America: Invest in a smarter electricity infrastructure
Smart Grid Modernization unites distributed energy resources, energy storage, EV charging, advanced metering, and bidirectional…
View more
Sign Up for Electricity Forum’s Newsletter
Stay informed with our FREE Newsletter — get the latest news, breakthrough technologies, and expert insights, delivered straight to your inbox.
Electricity Today T&D Magazine Subscribe for FREE

Stay informed with the latest T&D policies and technologies.
- Timely insights from industry experts
- Practical solutions T&D engineers
- Free access to every issue
