Electrical Commissioning In Industrial Power Systems
Our customized live online or in‑person group training can be delivered to your staff at your location.

- Live Online
- 12 hours Instructor-led
- Group Training Available
Regular Price:
$599
Coupon Price:
$499
Pacific Gas and Electric Co. customers endure more frequent and longer-lasting blackouts than other Californians, state data show.
The recent power outage in San Francisco and the Peninsula was no isolated incident. In 2006, the average PG&E customer lost power for more than 4 1/2 hours, according to statistics compiled by the utility and submitted to state energy regulators.
In contrast, Southern California Edison's average customer lost half as much time to blackouts - not quite 2 1/2 hours. And residents of San Diego fared even better, spending less than an hour without power all year.
PG&E's performance exasperates many of its customers and has fueled unsuccessful attempts in several cities - including the company's hometown of San Francisco - to break away from the vast utility.
San Francisco Mayor Gavin Newsom expressed frustration that the city had experienced another blackout.
"We've been through this so many times," he said after his staff met with PG&E representatives. "There's nothing more I can say. I've already said (everything) to them. Should I handcuff them? Arrest them? Should I bring them all to justice? Should I sue them? Obviously, we're not happy. Obviously, they're not happy."
PG&E still had not determined the cause of the blackout by that afternoon. But company representatives said they had made progress improving service in San Francisco in recent years, including installing another high-voltage line on the Peninsula to bring power into the city. Utility President Bill Morrow called the outage unacceptable.
"The performance does not reflect the level and quality of service that we are committed to providing customers and that they expect from PG&E," Morrow said in a prepared statement. Causes of Bay Area blackouts have varied from the startling to the mundane.
In 2003, for example, a fire at a San Francisco substation cut power to 120,000 customers the weekend before Christmas. In contrast, about 17,000 customers in the East Bay lost power last week in outages that the utility blamed on light rain, which mixed with dust to form mud, which caused equipment to short.
Many customers were stunned that such minor rainfall - less than a tenth of an inch in most places - could wreak such havoc.
"It was the most ridiculous thing I ever heard," said Rebecca Renfro, whose Berkeley home went without power for roughly 12 hours. "I thought, 'Wait a minute, this was not the first time in the history of the universe that there has been drizzle.' "
The company's blackouts occasionally have cost it money. PG&E agreed to pay $6.5 million in lieu of fines for the December 2003 outage. And the company's overall outage performance in 2005 triggered a $9.2 million penalty from the California Public Utilities Commission.
California's utilities keep tabs on their annual performance by compiling statistics that measure the frequency and length of blackouts year after year. One measurement - known as the system average interruption duration index, or SAIDI - adds up the duration of blackouts experienced during the year and divides that by the company's total number of customers.
PG&E's average customer went without power for 280.5 minutes last year, according to data compiled by the company and submitted to state energy regulators. Southern California Edison's average customer was blacked out for 142.3 minutes, and San Diego Gas and Electric's, 52.8 minutes.
The Sacramento Municipal Utility District recorded 99.3 minutes without power for the average customer last year. The Los Angeles Department of Water and Power did not have comparable data available for 2006.
Utilities use a similar statistic to measure how often blackouts occur. Called the system average interruption frequency index, or SAIFI, this measurement counts the utility's total number of outages during the year and divides that by the number of customers.
There again, PG&E fared worse than its fellow California utilities in 2006.
The company's average customer lost power 1.7 times, compared to 1.1 times for Southern California Edison, 0.5 times for San Diego Gas and Electric Co. and 1.4 times for the Sacramento Municipal Utility District.
PG&E representatives often point out that their electrical distribution system is larger than the other utilities', spanning the territory from the Humboldt County coast to Bakersfield. It serves more customers - many of them living in remote and rugged terrain - and endures more frequent storms than the southern part of the state.
But some utilities in states with far worse weather still manage to rack up better performance statistics than PG&E.
Wisconsin, which endures blizzards in the winter and severe thunderstorms in the summer, had only one of the state's five large utilities reporting more than 160 minutes of outages for the average customer in 2006. In neighboring Minnesota, the highest number was 118 minutes.
Ed Salas, PG&E's senior vice president for engineering and operations, said not all utilities compile their data in quite the same way, even if they use the same basic formula. That's true when comparing within California as well as state to state, he said.
"You don't really have a clean ability on an apples-to-apples basis to compare, from one utility to another," Salas said.
California energy regulators allow utilities to compile a second set of statistics excluding outages that strike during government-declared emergencies or freak weather events, like last July's record-setting heat wave. By that standard, PG&E's performance has been improving steadily for three years. The average customer last year experienced 150.8 minutes of blackouts, compared with 187.1 minutes the previous year and 205.1 minutes in 2003.
Without those exceptions, PG&E's performance has been worsening since 2004, when the utility's average customer experienced 205.3 minutes of blackouts.
Salas said excluding unusual weather from the statistics shows the system's underlying health. States along the Gulf Coast, for example, would have seriously skewed statistics if they counted outages during hurricanes.
"If you're in the South, I'm not sure that including the Katrina effects would really tell you how your system performs," Salas said.
Still, some of the company's critics claim PG&E is excluding too many storms from its data in an effort to make the utility look better.
The Utility Reform Network, a local watchdog group, recently filed a complaint with state regulators after PG&E requested a $151,899 bonus for meeting performance goals set by the state. The utility excluded blackouts caused by minor winter storms, said the group's staff attorney, Matt Freedman.
"It's easy to get a reward when you remove all the days when you have outages," said Freedman, whose group argues that PG&E should face a $5.1 million penalty instead.
Related News
Turning thermal energy into electricity
Near-Field Thermophotovoltaics captures radiated energy across a nanoscale gap, using thin-film photovoltaic cells and indium…
View more
Texans to vote on funding to modernize electricity generation
Texas Proposition 7 Energy Fund will finance ERCOT grid reliability via loans and grants for…
View more
Ireland makes EU Grids Package top energy priority to ease T&D bottlenecks
EU Grids Package leads Ireland's energy agenda, with permitting reform and cross-border transmission rules prioritized…
View more
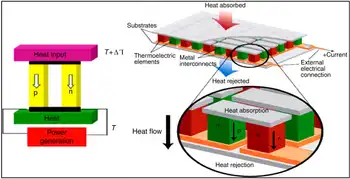
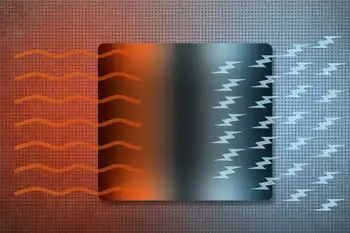
A new approach finds materials that can turn waste heat into electricity
Thermoelectric Materials convert waste heat into electricity via the Seebeck effect; quantum computations and semiconductors…
View more

Texas utility companies waiving fees; city has yet to act
Texas Utility COVID-19 Relief suspends disconnections, waives late fees, extends payment plans, and supports broadband…
View more

Group of premiers band together to develop nuclear reactor technology
Small Modular Reactors in Canada are advancing through provincial collaboration, offering nuclear energy, clean power…
View more
Sign Up for Electricity Forum’s Newsletter
Stay informed with our FREE Newsletter — get the latest news, breakthrough technologies, and expert insights, delivered straight to your inbox.
Electricity Today T&D Magazine Subscribe for FREE

Stay informed with the latest T&D policies and technologies.
- Timely insights from industry experts
- Practical solutions T&D engineers
- Free access to every issue
