Vietnam's power building surge pressures coal imports

By Industrial Info


Protective Relay Training - Basic

Our customized live online or in‑person group training can be delivered to your staff at your location.

  • Live Online
  • 12 hours Instructor-led
  • Group Training Available
Regular Price:
$699
Coupon Price:
$599
Reserve Your Seat Today
State-owned Electricity of Vietnam (EVN) and Ha Thanh Securities Company have announced that they have formed a joint venture to build a 2,400-megawatt coal-fired power plant in Vietnam's central Quang Binh province.

The joint venture will also build a port for the incoming coal to feed the Hon La plant.

The plant will promote local economic development and investment. In addition to the $2.4 billion power plant, the partners will also build a golf course and a five-star hotel in the Bao Ninh commune in Dong Hoi city.

A series of new coal-fed power plants are now planned or under construction. J-Power is planning a $2.4 billion coal-fired plant in Ba Ria-Vung Tau, and Sumitomo's $3.8 billion plant in Kanh Hoa province could be commissioned by 2012. These are going to put pressure on coal supplies. Other companies planning power plants are France's EDF, Malaysia's Toyo, Japan's Kyushu Electric Power and Sojitz, and the Czech Republic's CEZ.

Vietnam currently imports only a marginal amount of coal and is a net coal exporter to China for power feeds and to Japan for the steel industry. In 2006, exports doubled to 29.8 million tons and maintained that rate in 2007. But with power demand forecast to grow at a rate of 15% per annum through 2010, the country is looking to control coal exports while maintaining the high-margin export trade to Japan.

In a turnaround, Vietnam could be importing 20 million to 30 million tons of coal per annum from 2010 to 2020. In a long-term economic and industrial plan developed by the Vietnamese government, the country could be consuming 80 million tons of coal by 2025. Indonesia and Australia are positioned to take up the import demand.

With a growing population of more than 85 million and a growth rate of more than 8%, the country has been experiencing power outages that add urgency to the power building program and the organization of coal imports.

Related News

Ontario's electric debacle: Liberal leadership candidates on how they'd fix power

Ontario Electricity Policy debates rates, subsidies, renewables, nuclear baseload, and Quebec hydro imports, highlighting grid transmission limits, community consultation, conservation, and the province's energy mix after cancelled wind projects and rising costs to taxpayers.


Key Points

Ontario Electricity Policy guides rates, generation, grid planning, subsidies and imports for reliable, low-cost power.

✅ Focuses on rates, subsidies, and consumer affordability

✅ Balances nuclear baseload, renewables, and Quebec hydro imports

✅ Emphasizes grid transmission, consultation, and conservation


When Kathleen Wynne’s Liberals went down to defeat at the hands of Doug Ford and the Progressive Conservatives, Ontario electricity had a lot to do with it. That was in 2018. Now, two years later, Ford’s government has electricity issues of its own, including a new stance on wind power that continues to draw scrutiny.

Electricity is politically fraught in Ontario. It’s among the most expensive in Canada. And it has been mismanaged at least as far back as nuclear energy cost overruns starting in the 1980s.

From the start Wynne’s government was tainted by the gas plant scandal of her predecessor Dalton McGuinty and then she created her own with the botched roll-out of her green energy plan. And that helped Ford get elected promising to lower electricity prices. But, rates haven’t gone down under Ford while the cost to the government coffers for subsidizing them have soared - now costing $5.6 billion a year.

Meanwhile, Ford’s government has spent at least $230 million to tear up green energy contracts signed by the former Liberal government, including two wind-farm projects that were already mid-construction.

Lessons learned?
In the final part of a three-part series, the six candidates vying to become the next leader of the Ontario Liberals discuss the province's electricity system, including the lessons learned from the prior Liberal government's botched attempts to fix it that led to widespread local opposition to a string of wind power projects, and whether they'd agree to import more hydroelectricity from Quebec.

“We had the right idea but didn’t stick the landing,” said Steven Del Duca, a member of the former Wynne government who lost his Vaughan-area seat in 2018, referring to its green-energy plan. “We need to make sure that we work more collaboratively with local communities to gain the buy-in needed to be successful in this regard.”

“Consultation and listening is key,” agreed Mitzie Hunter, who was education minister under Kathleen Wynne and in 2018 retained her seat in the legislature representing Scarborough-Guildwood. “We must seek input from community members about investments locally,” she said. “Inviting experts in to advise on major policy is also important to make evidence-based decisions."

Michael Coteau, MPP for Don Valley East and the third leadership candidate who was a member of the former government, called for “a new relationship of respect and collaboration with municipalities.”

He said there is an “important balance to be achieved between pursuing province wide objectives for green-energy initiatives and recognizing and reflecting unique local conditions and circumstances.”

Kate Graham, who has worked in municipal public service and has not held a provincial public office, said that experts and local communities are best placed to shape decisions in the sector.

In the final part of a three-part series, Ontario's Liberal leadership contenders discuss electricity, lessons learned from the bungled rollout of previous Liberal green policy, and whether to lean more on Quebec's hydroelectricity.
“What's gotten Ontario in trouble in the past is when Queen's Park politicians are the ones micromanaging the electricity file,” she said.

“Community consultation is vitally important to the long-term success of infrastructure projects,” said Alvin Tedjo, a former policy adviser to Liberal ministers Brad Duguid and Glen Murray.

“Community voices must be heard and listened to when large-scale energy programs are going to be implemented,” agreed Brenda Hollingsworth, a personal injury lawyer making her first foray into politics.

Of the six candidates, only Coteau went beyond reflection to suggest a path forward, saying he would review the distribution of responsibilities between the province and municipalities, with the aim of empowering cities and towns.

Turn back to Quebec?
Ford’s government has also turned away from a deal signed in 2016 to import hydroelectricity from Quebec.

Graham and Hunter both said they would consider increasing such imports. Hunter noted that the deal, which would displace domestic natural gas production, will lower the cost of electricity paid by Ontario ratepayers by a net total of $38 million from 2017 to 2023, according to the province’s fiscal watchdog.

“I am open to working with our neighbouring province,” Hunter said. “This is especially important as we seek to bring electricity to remote northern, on-reserve Indigenous communities.”

Tedjo said he has no issues with importing clean energy as long as it’s at a fair price.

Hollingsworth and Coteau both said they would withhold judgment until they could see the province’s capacity status in 2022.

“In evaluating the case for increasing importation of water power from Quebec, we must realistically assess the limitations of the existing transmission system and the cost and time required to scale up transmission infrastructure, among other factors,” Coteau said.

Del Duca also took a wait-and-see approach. “This will depend on our energy needs and energy mix,” he said. “I want to see our energy needs go down; we need more efficiency and better conservation to make that happen.”

What's the right energy mix?
Nuclear energy currently accounts for about a third of Ontario’s energy-producing capacity, even as Canada explores zero-emissions electricity by 2035 pathways. But it actually supplies about 60 percent of Ontario’s electricity. That is because nuclear reactors are always on, producing so-called baseload power.

Hydroelectricity provides another 25 percent of supply, while oil and natural gas contribute 6 per cent and wind adds 7 percent. Both solar and biofuels account for less than one percent of Ontario’s energy supply. However, a much larger amount of solar is not counted in this tally, as it is used at or near the sites where it is generated, and never enters the transmission system.

Asked for their views on how large a role various sources of power should play in Ontario’s electricity mix in the future, the candidates largely backed the idea of renewable energy, but offered little specifics.

Graham repeated her statement that experts and communities should drive that conversation. Tedjo said all non-polluting technologies should play a role in Ontario’s energy mix, as provinces like Alberta demonstrate parallel growth in green energy and fossil fuels. Coteau said we need a mix of renewable-energy sources, without offering specifics.

“We also need to pursue carbon capture and sequestration, working in particular with our farming communities,” he added.


Related News

View more

Typical Ontario electricity bill set to increase nearly 2% as fixed pricing ends

Ontario Electricity Rates update: OEB sets time-of-use and tiered pricing for residential customers, with kWh charges for peak, mid-peak, and off-peak periods reflecting COVID-19 impacts on demand, supply costs, and pricing.


Key Points

Ontario Electricity Rates are OEB-set time-of-use and tiered prices that set per-kWh costs for residential customers.

✅ Time-of-use: 21.7 peak, 15.0 mid-peak, 10.5 off-peak cents/kWh

✅ Tiered: 12.6 cents/kWh up to 1000 kWh, then 14.6 cents/kWh

✅ Average 700 kWh home pays about $2.24 more per month


Energy bills for the typical Ontario home are going up by about two per cent with fixed pricing coming to an end on Nov. 1, the Ontario Energy Board says. 

The province's electricity regulator has released new time-of-use pricing and says the rate for the average residential customer using 700 kWh per month will increase by about $2.24.

The change comes as Ontario stretches into its eight month of the COVID-19 pandemic with new case counts reaching levels higher than ever seen before.

Time-of-use pricing had been scrapped for residential bills for much for the pandemic with a single fixed COVID-19 hydro rate set for all hours of the day. The move, which came into effect June 1, was meant "to support families, small business and farms while Ontario plans for the safe and gradual reopening of the province," the OEB said at the time.

Ontario later set the off-peak price until February 7 around the clock to provide additional relief.

Fixed pricing meant customers' bills reflected how much power they used, rather than when they used it. Customers were charged 12.8 cents/kWh under the COVID-19 recovery rate no matter their time of use.

Beginning November, the province says customers can choose between time-of-use and tiered pricing options. Rates for time-of-use plans will be 21.7 cents/kWh during peak hours, 15 cents/kWh for mid-peak use and 10.5 cents/kWh for off-peak use. 

Customers choosing tiered pricing will pay 12.6 cents/kWh for the first 1000 kWh each month and then 14.6 cents/kWh for any power used beyond that.

The energy board says the increase in pricing reflects "a combination of factors, including those associated with the COVID-19 pandemic, that have affected demand, supply costs and prices in the summer and fall of 2020."

Asked for his reaction to the move Tuesday, Premier Doug Ford said, "I hate it," adding the province inherited an energy "mess" from the previous Liberal government and are "chipping away at it."


Related News

View more

U.S. Electric Vehicle Market Share Dips in Q1 2024

U.S. EV Market Share Dip Q1 2024 reflects slower BEV adoption, rising PHEV demand, affordability concerns, charging infrastructure gaps, tax credit shifts, range anxiety, and automaker strategy adjustments across the electric vehicle market.


Key Points

Q1 2024 EV and hybrid share slipped as BEV sales lag, PHEVs rise, and affordability and charging concerns temper demand.

✅ BEV share fell to 7.0% as affordable models remain limited

✅ PHEV sales rose 50% YoY, easing range anxiety concerns

✅ Policy shifts and charging gaps weigh on consumer adoption


The U.S. electric vehicle (EV) market, once a beacon of unbridled growth, appears to be experiencing a course correction. Data from the U.S. Energy Information Administration (EIA) reveals that the combined market share of electric vehicles (battery electric vehicles, or BEVs) and hybrids dipped slightly in the first quarter of 2024, marking the first decline since the onset of the COVID-19 pandemic, even as EU EV share rose during lockdowns in 2020.

This news comes as a surprise to many analysts who predicted continued exponential growth for the EV market. While overall sales of electric vehicles surged into 2024 and did increase by 7% compared to Q1 2023, this growth wasn't enough to keep pace with the overall rise in vehicle sales. The result: a decline in market share from 18.8% in Q4 2023 to 18.0% in Q1 2024.

Several factors may be contributing to this shift. One potential culprit is a slowdown in battery electric vehicle sales. BEVs saw their share of the market dip from 8.1% to 7.0% in the same period. This could be attributed to a lack of readily available affordable options, with many popular EV models still commanding premium prices and concerns that EV supply may miss demand in the near term.

Another factor could be the rising interest in plug-in hybrid electric vehicles (PHEVs). PHEV sales witnessed a significant jump of 50% year-over-year, reflecting how gas-electric hybrids are getting a boost from major automakers, potentially indicating a consumer preference for vehicles that offer both electric and gasoline powertrain options, addressing concerns about range anxiety often associated with BEVs.

Industry experts offer mixed interpretations of this data. Some downplay the significance of the dip, attributing it to a temporary blip, even though EVs remain behind gas cars in total sales. They point to the ongoing commitment from major automakers to invest in EV production and the potential for new, more affordable models to hit the market soon.

Others express more concern, citing Europe's recent EV slump and suggesting this might be a sign of maturing consumer preferences. They argue that simply increasing the number of EVs on the market might not be enough. Automakers need to address issues like affordability, charging infrastructure, and range anxiety to maintain momentum.

The role of government incentives also remains a question mark. The federal tax credit for electric vehicles is currently set to phase out gradually, potentially impacting consumer purchasing decisions in the future. Continued government support, through incentives or infrastructure development, could be crucial in maintaining consumer interest.

The coming quarters will be crucial in determining the long-term trajectory of the U.S. EV market, especially after the global electric car market's rapid expansion in recent years. Whether this is a temporary setback or a more lasting trend remains to be seen. Addressing consumer concerns, ensuring a diverse range of affordable EV options, and continued government support will all be essential in ensuring the continued growth of this critical sector.

This development also presents an opportunity for traditional automakers. By capitalizing on the growing PHEV market and addressing consumer concerns about affordability and range anxiety, they can carve out a strong position in the evolving automotive landscape.


Related News

View more

Which of the cleaner states imports dirty electricity?

Hourly Electricity Emissions Tracking maps grid balancing areas, embodied emissions, and imports/exports, revealing carbon intensity shifts across PJM, ERCOT, and California ISO, and clarifying renewable energy versus coal impacts on health and climate.


Key Points

An hourly method tracing generation, flows, and embodied emissions to quantify carbon intensity across US balancing areas.

✅ Hourly traces of imports/exports and generation mix

✅ Consumption-based carbon intensity by balancing area

✅ Policy insights for renewables, coal, health costs


In the United States, electricity generation accounts for nearly 30% of our carbon emissions. Some states have responded to that by setting aggressive renewable energy standards; others are hoping to see coal propped up even as its economics get worse. Complicating matters further is the fact that many regional grids are integrated, and as America goes electric the stakes grow, meaning power generated in one location may be exported and used in a different state entirely.

Tracking these electricity exports is critical for understanding how to lower our national carbon emissions. In addition, power from a dirty source like coal has health and environment impacts where it's produced, and the costs of these aren't always paid by the parties using the electricity. Unfortunately, getting reliable figures on how electricity is produced and where it's used is challenging, even for consumers trying to find where their electricity comes from in the first place, leaving some of the best estimates with a time resolution of only a month.

Now, three Stanford researchers—Jacques A. de Chalendar, John Taggart, and Sally M. Benson—have greatly improved on that standard, and they have managed to track power generation and use on an hourly basis. The researchers found that, of the 66 grid balancing areas within the United States, only three have carbon emissions equivalent to our national average, and they have found that imports and exports of electricity have both seasonal and daily changes. de Chalendar et al. discovered that the net results can be substantial, with imported electricity increasing California's emissions/power by 20%.

Hour by hour
To figure out the US energy trading landscape, the researchers obtained 2016 data for grid features called balancing areas. The continental US has 66 of these, providing much better spatial resolution on the data than the larger grid subdivisions. This doesn't cover everything—several balancing areas in Canada and Mexico are tied in to the US grid—and some of these balancing areas are much larger than others. The PJM grid, serving Pennsylvania, New Jersey, and Maryland, for example, is more than twice as large as Texas' ERCOT, in a state that produces and consumes the most electricity in the US.

Despite these limitations, it's possible to get hourly figures on how much electricity was generated, what was used to produce it, and whether it was used locally or exported to another balancing area. Information on the generating sources allowed the researchers to attach an emissions figure to each unit of electricity produced. Coal, for example, produces double the emissions of natural gas, which in turn produces more than an order of magnitude more carbon dioxide than the manufacturing of solar, wind, or hydro facilities. These figures were turned into what the authors call "embodied emissions" that can be traced to where they're eventually used.

Similar figures were also generated for sulfur dioxide and nitrogen oxides. Released by the burning of fossil fuels, these can both influence the global climate and produce local health problems.

Huge variation
The results were striking. "The consumption-based carbon intensity of electricity varies by almost an order of magnitude across the different regions in the US electricity system," the authors conclude. The low is the Bonneville Power grid region, which is largely supplied by hydropower; it has typical emissions below 100kg of carbon dioxide per megawatt-hour. The highest emissions come in the Ohio Valley Electric region, where emissions clear 900kg/MW-hr. Only three regional grids match the overall grid emissions intensity, although that includes the very large PJM (where capacity auction payouts recently fell), ERCOT, and Southern Co balancing areas.

Most of the low-emissions power that's exported comes from the Pacific Northwest's abundant hydropower, while the Rocky Mountains area exports electricity with the highest associated emissions. That leads to some striking asymmetries. Local generation in the hydro-rich Idaho Power Company has embodied emissions of only 71kg/MW-hr, while its imports, coming primarily from Rocky Mountain states, have a carbon content of 625kg/MW-hr.

The reliance on hydropower also makes the asymmetry seasonal. Local generation is highest in the spring as snow melts, but imports become a larger source outside this time of year. As solar and wind can also have pronounced seasonal shifts, similar changes will likely be seen as these become larger contributors to many of these regional grids. Similar things occur daily, as both demand and solar production (and, to a lesser extent, wind) have distinct daily profiles.

The Golden State
California's CISO provides another instructive case. Imports represent less than 30% of its total electric use in 2016, yet California electricity imports provided 40% of its embodied emissions. Some of these, however, come internally from California, provided by the Los Angeles Department of Water and Power. The state itself, however, has only had limited tracking of imported emissions, lumping many of its sources as "other," and has been exporting its energy policies to Western states in ways that shape regional markets.

Overall, the 2016 inventory provides a narrow picture of the US grid, as plenty of trends are rapidly changing our country's emissions profile, including the rise of renewables and the widespread adoption of efficiency measures and other utility trends in 2017 that continue to evolve. The method developed here can, however, allow for annual updates, providing us with a much better picture of trends. That could be quite valuable to track things like how the rapid rise in solar power is altering the daily production of clean power.

More significantly, it provides a basis for more informed policymaking. States that wish to promote low-emissions power can use the information here to either alter the source of their imports or to encourage the sites where they're produced to adopt more renewable power. And those states that are exporting electricity produced primarily through fossil fuels could ensure that the locations where the power is used pay a price that includes the health costs of its production.


Related News

View more

Electricity in Spain is 682.65% more expensive than the same day in 2020

Spain Electricity Prices surge to record highs as the wholesale market hits €339.84/MWh, driven by gas costs and CO2 permits, impacting PVPC regulated tariffs, free-market contracts, and household energy bills, OMIE data show.


Key Points

Rates in Spain's wholesale market that shape PVPC tariffs and free-market bills, moving with gas prices and CO2 costs.

✅ Record €339.84/MWh; peak 20:00-21:00; low 04:00-05:00 (OMIE).

✅ PVPC users and free-market contracts face higher bills.

✅ Drivers: high gas prices and rising CO2 emission rights.


Electricity in Spain's wholesale market will rise in price once more as European electricity prices continue to surge. Once again, it will set a historical record in Spain, reaching €339.84/MWh. With this figure, it is already the fifth time that the threshold of €300 has been exceeded.

This new high is a 6.32 per cent increase on today’s average price of €319.63/MWh, which is also a historic record, while Germany's power prices nearly doubled over the past year. Monday’s energy price will make it 682.65 per cent higher than the corresponding date in 2020, when the average was €43.42.

According to data published by the Iberian Energy Market Operator (OMIE), Monday’s maximum will be between the hours of 8pm and 9pm, reaching €375/MWh, a pattern echoed by markets where Electric Ireland price hikes reflect wholesale volatility. The cheapest will be from 4am to 5am, at €267.99.

The prices of the ‘pool’ have a direct effect on the regulated tariff  – PVPC – to which almost 11 million consumers in the country are connected, and serve as a reference for the other 17 million who have contracted their supply in the free market, where rolling back prices is proving difficult across Europe.

These spiraling prices in recent months, which have fueled EU energy inflation, are being blamed on high gas prices in the markets, and carbon dioxide (CO2) emission rights, both of which reached record highs this year.

According to an analysis by Facua-Consumidores en Acción, if the same rates were maintained for the rest of the month, the last invoice of the year would reach €134.45 for the average user. That would be 94.1 per cent above the €69.28 for December 2020, while U.S. residential electricity bills rose about 5% in 2022 after inflation adjustments.

The average user’s bill so far this year has increased by 15.1 per cent compared to 2018, as US electricity prices posted their largest jump in 41 years. Thus, compared to the €77.18 of three years ago, the average monthly bill now reaches €90.87 euros. However, the Government continues to insist that this year households will end up paying the same as in 2018.

As Ruben Sanchez, the general secretary of Facua commented, “The electricity bill for December would have to be negative for President Sanchez, and Minister Ribera, to fulfill their promise that this year consumers will pay the same as in 2018 once the CPI has been discounted”.


Related News

View more

UK low-carbon electricity generation stalls in 2019

UK low-carbon electricity 2019 saw stalled growth as renewables rose slightly, wind expanded, nuclear output fell, coal hit record lows, and net-zero targets demand faster deployment to cut CO2 intensity below 100gCO2/kWh.


Key Points

Low-carbon sources supplied 54% of UK power in 2019, up just 1TWh; wind grew, nuclear fell, and coal dropped to 2%.

✅ Wind up 8TWh; nuclear down 9TWh amid outages

✅ Fossil fuels 43% of generation; coal at 2%

✅ Net-zero needs 15TWh per year added to 2030


The amount of electricity generated by low-carbon sources in the UK stalled in 2019, Carbon Brief analysis shows.

Low-carbon electricity output from wind, solar, nuclear, hydro and biomass rose by just 1 terawatt hour (TWh, less than 1%) in 2019. It represents the smallest annual increase in a decade, where annual growth averaged 9TWh. This growth will need to double in the 2020s to meet UK climate targets while replacing old nuclear plants as they retire.

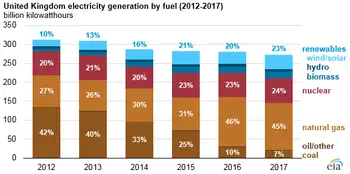
Some 54% of UK electricity generation in 2019 came from low-carbon sources, including 37% from renewables and 20% from wind alone, underscoring wind's leading role in the power mix during key periods. A record-low 43% was from fossil fuels, with 41% from gas and just 2% from coal, also a record low. In 2010, fossil fuels generated 75% of the total.

Carbon Brief’s analysis of UK electricity generation in 2019 is based on figures from BM Reports and the Department for Business, Energy and Industrial Strategy (BEIS). See the methodology at the end for more on how the analysis was conducted.

The numbers differ from those published earlier in January by National Grid, which were for electricity supplied in Great Britain only (England, Wales and Scotland, but excluding Northern Ireland), including via imports from other countries.

Low-carbon low
In 2019, the UK became the first major economy to target net-zero greenhouse gas emissions by 2050, increasing the ambition of its legally binding Climate Change Act.

To date, the country has cut its emissions by around two-fifths since 1990, with almost all of its recent progress coming from the electricity sector.

Emissions from electricity generation have fallen rapidly in the decade since 2010 as coal power has been almost phased out and even gas output has declined. Fossil fuels have been displaced by falling demand and by renewables, such as wind, solar and biomass.

But Carbon Brief’s annual analysis of UK electricity generation shows progress stalled in 2019, with the output from low-carbon sources barely increasing compared to a year earlier.

The chart below shows low-carbon generation in each year since 2010 (grey bars) and the estimated level in 2019 (red). The pale grey bars show the estimated future output of existing low-carbon sources after old nuclear plants retire and the pale red bars show the amount of new generation needed to keep electricity sector emissions to less than 100 grammes of CO2 per kilowatt hour (gCO2/kWh), the UK’s nominal target for the sector.

 Annual electricity generation in the UK by fuel, terawatt hours, 2010-2019. Top panel: fuel by fuel. Bottom panel: cumulative total generation from all sources. Source: BEIS energy trends, BM Reports and Carbon Brief analysis. Chart by Carbon Brief using Highcharts.
As the chart shows, the UK will require significantly more low-carbon electricity over the next decade as part of meeting its legally binding climate goals.

The nominal 100gCO2/kWh target for 2030 was set in the context of the UK’s less ambitious goal of cutting emissions to 80% below 1990 levels by 2050. Now that the country is aiming to cut emissions to net-zero by 2050, that 100gCO2/kWh indicator is likely to be the bare minimum.

Even so, it would require a rapid step up in the pace of low-carbon expansion, compared to the increases seen over the past decade. On average, low-carbon generation has risen by 9TWh each year in the decade since 2010 – including a rise of just 1TWh in 2019.

Given scheduled nuclear retirements and rising demand expected by the Committee on Climate Change (CCC) – with some electrification of transport and heating – low-carbon generation would need to increase by 15TWh each year until 2030, just to meet the benchmark of 100gCO2/kWh.

For context, the 3.2 gigawatt (GW) Hinkley C new nuclear plant being built in Somerset will generate around 25TWh once completed around 2026. The world’s largest offshore windfarm, the 1.2GW Hornsea One scheme off the Yorkshire coast, will generate around 5TWh each year.

The new Conservative government is targeting 40GW of offshore wind by 2030, up from today’s figure of around 8GW. If policies are put in place to meet this goal, then it could keep power sector emissions below 100gCO2/kWh, depending on the actual performance of the windfarms built.

However, new onshore wind and solar, further new nuclear or other low-carbon generation, such as gas with carbon capture and storage (CCS), is likely to be needed if demand is higher than expected, or if the 100gCO2/kWh benchmark is too weak in the context of net-zero by 2050.

The CCC says it is “likely” to “reflect the need for more rapid deployment” of low-carbon towards net-zero emissions in its advice on the sixth UK carbon budget for 2033-2037, due in September.

Trading places
Looking more closely at UK electricity generation in 2019, Carbon Brief’s analysis shows why there was so little growth for low-carbon sources compared to the previous year.

There was another increase for wind power in 2019 (up 8TWh, 14%), with record wind generation as several large new windfarms were completed including the 1.2GW Hornsea One project in October and the 0.6GW Beatrice offshore windfarm in Q2 of 2019. But this was offset by a decline for nuclear (down 9TWh, 14%), due to ongoing outages for reactors at Hunterston in Scotland and Dungeness in Kent.

(Analysis of data held by trade organisation RenewableUK suggests some 0.6GW of onshore wind capacity also started operating in 2019, including the 0.2GW Dorenell scheme in Moray, Scotland.)

As a result of these movements, the UK’s windfarms overtook nuclear for the first time ever in 2019, becoming the country’s second-largest source of electricity generation, and earlier, wind and solar together surpassed nuclear in the UK as momentum built. This is shown in the figure below, with wind (green line, top panel) trading places with nuclear (purple) and gas (dark blue) down around 25% since 2010 but remaining the single-largest source.

 Annual electricity generation in the UK by fuel, terawatt hours, 2010-2019. Top panel: fuel by fuel. Bottom panel: cumulative total generation from all sources. Source: BEIS energy trends, BM Reports and Carbon Brief analysis. Chart by Carbon Brief using Highcharts.
The UK’s currently suspended nuclear plants are due to return to service in January and March, according to operator EDF, the French state-backed utility firm. However, as noted above, most of the UK’s nuclear fleet is set to retire during the 2020s, with only Sizewell B in Suffolk due to still be operating by 2030. Hunterston is scheduled to retire by 2023 and Dungeness by 2028.

Set against these losses, the UK has a pipeline of offshore windfarms, secured via “contracts for difference” with the government, at a series of auctions. The most recent auction, in September 2019, saw prices below £40 per megawatt hour – similar to current wholesale electricity prices.

However, the capacity contracted so far is not sufficient to meet the government’s target of 40GW by 2030, meaning further auctions – or some other policy mechanism – will be required.

Coal zero
As well as the switch between wind and nuclear, 2019 also saw coal fall below solar for the first time across a full year, echoing the 2016 moment when wind outgenerated coal across the UK, after it suffered another 60% reduction in electricity output. Just six coal plants remain in the UK, with Aberthaw B in Wales and Fiddlers Ferry in Cheshire closing in March.

Coal accounted for just 2% of UK generation in 2019, a record-low coal share since centralised electricity supplies started to operate in 1882. The fuel met 40% of UK needs as recently as 2012, but has plummeted thanks to falling demand, rising renewables, cheaper gas and higher CO2 prices.

The reduction in average coal generation hides the fact that the fuel is now often not required at all to meet the UK’s electricity needs. The chart below shows the number of days each year when coal output was zero in 2019 (red line) and the two previous years (blue).

 Cumulative number of days when UK electricity generation from renewable sources has been higher than that from fossil fuels. Source: BEIS energy trends, BM Reports and Carbon Brief analysis. Chart by Carbon Brief using Highcharts.
The 83 days in 2019 with zero coal generation amount to nearly a quarter of the year and include the record-breaking 18-day stretch without the fuel.

Great Britain has been running for a record TWO WEEKS without using coal to generate electricity – the first time this has happened since 1882.

The country’s grid has been coal-free for 45% of hours in 2019 so far.https://www.carbonbrief.org/countdown-to-2025-tracking-the-uk-coal-phase-out …

Coal generation was set for significant reductions around the world in 2019 – including a 20% reduction for the EU as a whole – according to analysis published by Carbon Brief in November.

Notably, overall UK electricity generation fell by another 9TWh in 2019 (3%), bringing the total decline to 58TWh since 2010. This is equivalent to more than twice the output from the Hinkley C scheme being built in Somerset. As Carbon Brief explained last year, falling demand has had a similar impact on electricity-sector CO2 emissions as the increase in output from renewables.

This is illustrated by the fact that the 9TWh reduction in overall generation translated into a 9TWh (6%) cut in fossil-fuel generation during 2019, with coal falling by 10TWh and gas rising marginally.

Increasingly renewable
As fossil-fuel output and overall generation have declined, the UK’s renewable sources of electricity have continued to increase. Their output has risen nearly five-fold in the past decade and their share of the UK total has increased from 7% in 2010 to 37% in 2019.

As a result, the UK’s increasingly renewable grid is seeing more minutes, hours and days during which the likes of wind, solar and biomass collectively outpace all fossil fuels put together, and on some days wind is the main source as well.

The chart below shows the number of days during each year when renewables generated more electricity than fossil fuels in 2019 (red line) and each of the previous four years (blue lines). In total, nearly two-fifths of days in 2019 crossed this threshold.

 Cumulative number of days when the UK has not generated any electricity from coal. Source: BEIS energy trends, BM Reports and Carbon Brief analysis. Chart by Carbon Brief using Highcharts.
There were also four months in 2019 when renewables generated more of the UK’s electricity than fossil fuels: March, August, September and December. The first ever such month came in September 2018 and more are certain to follow.

National Grid, which manages Great Britain’s high-voltage electricity transmission network, is aiming to be able to run the system without fossil fuels by 2025, at least for short periods. At present, it sometimes has to ask windfarm operators to switch off and gas plants to start running in order to keep the electricity grid stable.

Note that biomass accounted for 11% of UK electricity generation in 2019, nearly a third of the total from all renewables. Some two-thirds of the biomass output is from “plant biomass”, primarily wood pellets burnt at Lynemouth in Northumberland and the Drax plant in Yorkshire. The remainder was from an array of smaller sites based on landfill gas, sewage gas or anaerobic digestion.

The CCC says the UK should “move away” from large-scale biomass power plants, once existing subsidy contracts for Drax and Lynemouth expire in 2027.

Using biomass to generate electricity is not zero-carbon and in some circumstances could lead to higher emissions than from fossil fuels. Moreover, there are more valuable uses for the world’s limited supply of biomass feedstock, the CCC says, including carbon sequestration and hard-to-abate sectors with few alternatives.

Methodology
The figures in the article are from Carbon Brief analysis of data from BEIS Energy Trends chapter 5 and chapter 6, as well as from BM Reports. The figures from BM Reports are for electricity supplied to the grid in Great Britain only and are adjusted to include Northern Ireland.

In Carbon Brief’s analysis, the BM Reports numbers are also adjusted to account for electricity used by power plants on site and for generation by plants not connected to the high-voltage national grid. This includes many onshore windfarms, as well as industrial gas combined heat and power plants and those burning landfill gas, waste or sewage gas.

By design, the Carbon Brief analysis is intended to align as closely as possible to the official government figures on electricity generated in the UK, reported in BEIS Energy Trends table 5.1.

Briefly, the raw data for each fuel is in most cases adjusted with a multiplier, derived from the ratio between the reported BEIS numbers and unadjusted figures for previous quarters.

Carbon Brief’s method of analysis has been verified against published BEIS figures using “hindcasting”. This shows the estimates for total electricity generation from fossil fuels or renewables to have been within ±3% of the BEIS number in each quarter since Q4 2017. (Data before then is not sufficient to carry out the Carbon Brief analysis.)

For example, in the second quarter of 2019, a Carbon Brief hindcast estimates gas generation at 33.1TWh, whereas the published BEIS figure was 34.0TWh. Similarly, it produces an estimate of 27.4TWh for renewables, against a BEIS figure of 27.1TWh.

National Grid recently shared its own analysis for electricity in Great Britain during 2019 via its energy dashboard, which differs from Carbon Brief’s figures.


Related News

View more

Sign Up for Electricity Forum’s Newsletter

Stay informed with our FREE Newsletter — get the latest news, breakthrough technologies, and expert insights, delivered straight to your inbox.

Electricity Today T&D Magazine Subscribe for FREE

Stay informed with the latest T&D policies and technologies.
  • Timely insights from industry experts
  • Practical solutions T&D engineers
  • Free access to every issue

Download the 2025 Electrical Training Catalog

Explore 50+ live, expert-led electrical training courses –

  • Interactive
  • Flexible
  • CEU-cerified