
CSA Z462 Arc Flash Training – Electrical Safety Compliance Course
Our customized live online or in‑person group training can be delivered to your staff at your location.

- Live Online
- 6 hours Instructor-led
- Group Training Available
Regular Price:
$249
Coupon Price:
$199
OTTAWA
—
Ottawa Hydro Substation Heritage Designation highlights Hydro Ottawa's 1920s architecture, Art Deco facades, and municipal utility history, protecting key voltage-reduction sites in Glebe, Carling-Merivale, Holland, King Edward, and Old Ottawa South.
Key Highlights
A city plan to protect Hydro Ottawa's 1920s substations for architecture, utility role, and civic electrical heritage.
Protects five 1920s substations with Art Deco and civic utility history.
Sites: Glebe, Carling-Merivale, Holland, King Edward, Old Ottawa South.
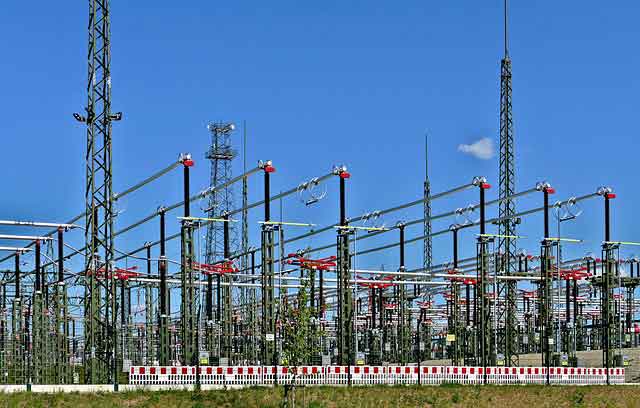
Facilities reduce transmission voltage for service to homes and businesses.
Heritage OK allows emergency work to preserve safety and grid continuity.
Notable architects: William Beattie and J. Albert Ewart.
The city of Ottawa is looking to designate five hydro substations built nearly a century ago as heritage structures, a move intended to protect the architectural history of Ottawa's earliest forays into the electricity business, even as Ottawa electricity consumption has shifted in recent years.
All five buildings are still used by Hydro Ottawa to reduce the voltage coming from transmission lines before the electricity is transmitted to homes and businesses, and when severe weather causes outages, Sudbury Hydro crews work to reconnect service across communities.
Electricity came to Ottawa in 1882 when two carbon lamps were installed on LeBreton Flats, heritage planner Anne Fitzpatrick told the city's built heritage subcommittee on Tuesday. It became a lucrative business, and soon a privately owned monopoly that drew public scrutiny similar to debates over retroactive charges in neighboring jurisdictions.
In 1905, city council held a special meeting to buy the electrical company, which led to a dramatic drop in electricity rates for residents, a contrast with recent discussions about peak hydro rates for self-isolating customers.
The substations are now owned by Hydro Ottawa, which agreed to the heritage designations on the condition it not be prevented from emergency demolitions if it needs to address incidents such as damaging storms in Ontario while it works to "preserve public safety and the continuity of critical hydro electrical services."
Built in 1922, the substation at the intersection of Glebe and Bronson avenues was the first to be built by the new municipal electrical department, long before modern battery storage projects became commonplace on Ontario's grid.
The largest of the substations being protected dates back to 1929 and is found at the corner of Carling Avenue and Merivale Road. It was built to accommodate a growing population in areas west of downtown including Hintonburg and Mechanicsville.
The substation on Holland Avenue near the Queensway is different from the others because it was built in 1924 to serve the Ottawa Electric Railway Company. The streetcar company operated from 1891 to 1959, and urban electrical infrastructure can face failures such as the Hydro-Québec manhole fire that left thousands without power.
This substation on King Edward Avenue was built in 1931 and designed by architect William Beattie, who also designed York Street Public School in Lowertown and the substation on Carling Avenue.
The last substation to be built in a 'bold and decorative style' is at 39 Riverdale Ave. in Old Ottawa South, according to city staff. It was designed in an Art Deco style by prominent architect J. Albert Ewart, who was also behind the Civic Hospital and nearby Southminster Church on Bank Street.
Related News

Shell says electricity to meet 60 percent of China's energy use by 2060
China 2060 Carbon-Neutral Energy Transition projects tripled electricity, rapid electrification, wind and solar dominance, scalable…
View more

EPA, New Taipei spar over power plant
Shenao Power Plant Controversy intensifies as the EPA, Taipower, and New Taipei officials clash over…
View more
Paris Finalises Energy Roadmap for 2025–2035 with Imminent Decree
France 2025–2035 Energy Roadmap accelerates carbon neutrality via renewables expansion, energy efficiency, EV adoption, heat…
View more

Electricity Shut-Offs in a Pandemic: How COVID-19 Leads to Energy Insecurity, Burdensome Bills
COVID-19 Energy Burden drives higher electricity bills as income falls, intensifying energy poverty, utility shut-offs,…
View more
Medicine Hat Grant Winners to Upgrade Grid and Use AI for Energy Savings
Medicine Hat Smart Grid AI modernizes electricity distribution with automation, sensors, and demand response, enhancing…
View more
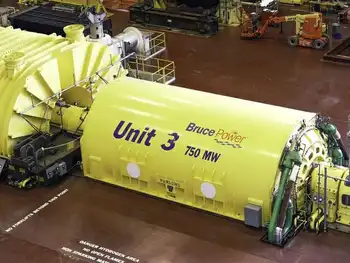
Bruce Power cranking out more electricity after upgrade
Bruce Power Capacity Uprate boosts nuclear output through generator stator upgrades, turbine and transformer enhancements,…
View more
Sign Up for Electricity Forum’s Newsletter
Stay informed with our FREE Newsletter — get the latest news, breakthrough technologies, and expert insights, delivered straight to your inbox.
Electricity Today T&D Magazine Subscribe for FREE

Stay informed with the latest T&D policies and technologies.
- Timely insights from industry experts
- Practical solutions T&D engineers
- Free access to every issue

