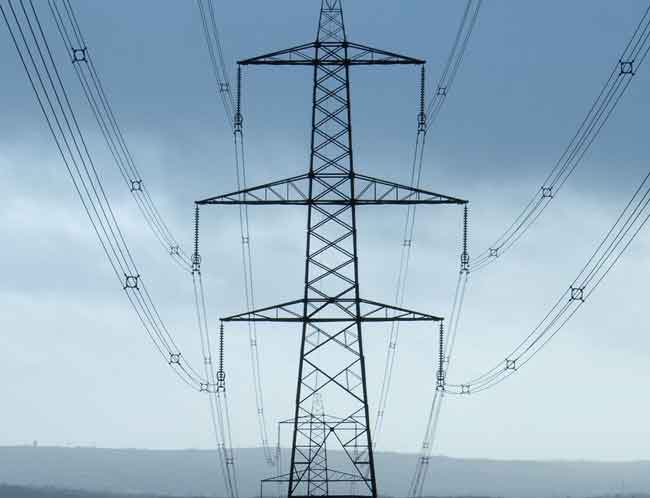
Algonquin Power & Utilities Corp. Completes Acquisition of The Empire District Electric Company


Electrical Testing & Commissioning of Power Systems

Our customized live online or in‑person group training can be delivered to your staff at your location.

  • Live Online
  • 12 hours Instructor-led
  • Group Training Available
Regular Price:
$599
Coupon Price:
$499
Reserve Your Seat Today

Algonquin Power & Utilities Empire acquisition expands Liberty Utilities' regulated footprint in U.S., adds Empire District Electric, increases 2,500 MW capacity, boosts dividend growth prospects, and delivers accretive cash flows in a Cdn$3.2 billion merger.


Key Points

A Cdn$3.2 billion Liberty Utilities deal to acquire Empire District Electric, expanding U.S. regulated operations.

✅ Purchase price Cdn$3.2B incl. US$0.8B debt; US$34 per share

✅ Empire delisted from NYSE; now a Liberty Utilities subsidiary

✅ Deal adds scale, 2,500 MW capacity, supports 10% dividend growth


Algonquin Power & Utilities Corp. announced today that a subsidiary of Liberty Utilities Co. ("Liberty Utilities"), APUC's wholly-owned regulated utility business, successfully completed its acquisition of The Empire District Electric Company ("Empire"), amid the Hydro One-Avista backlash around U.S. utility takeovers, for an aggregate purchase price of approximately Cdn$3.2 billion (the "Transaction"). Empire is now a wholly-owned subsidiary of Liberty Utilities and will cease to be a publicly-held corporation.

With the closing of the Transaction, APUC has materially expanded its utility operations in the United States. APUC, through its 2,200 employees, now serves over 782,000 electric, gas, and water customers within its regulated utility business, and APUC's portfolio of power generating facilities now contains both regulated and non-regulated power facilities, as peers such as Duke Energy's renewables push indicate across the sector, with a total capacity of over 2,500 MW.

"Empire is highly complementary to the scope of our current operations, brings valuable scale to our existing utility business, and adds further support to our annual dividend growth target of 10% through significant accretion to per share cash flows and earnings," said Ian Robertson, Chief Executive Officer of APUC. "The APUC and Empire teams have worked diligently to successfully bring our companies together, and we are excited about the many opportunities that our newly expanded platform brings to our growth prospects in North America, where outcomes like the CPUC ruling favoring community energy are reshaping markets."

As previously announced, and in a landscape where Hydro One-Avista deal rejected highlighted regulatory risk, Empire's shareholders will receive US$34.00 per common share which, including the assumption of approximately US$0.8 billion of debt at closing, represents an aggregate purchase price of approximately US$2.3 billion (Cdn$3.2 billion).

As a result of the closing, Empire's common stock is being delisted from the New York Stock Exchange. Empire shareholders will be provided with instructions on how to receive the merger consideration for their shares by Wells Fargo, in its capacity as paying agent for the transaction, even as proceedings like El Paso Electric's 2017 Texas rate case continue to draw attention.

APUC will issue shortly a final instalment notice (the "Final Instalment Notice") notifying holders of its 5% convertible unsecured subordinated debentures ("Debentures") represented by instalment receipts of the date for payment of the final instalment (the "Final Instalment Date"), which shall not be less than 15 days nor more than 90 days following the date of such notice in accordance with the terms of the instalment receipts. Additional details will be set out in the Final Instalment Notice regarding, among other things, the right of holders of Debentures who have paid the final instalment to receive a make-whole payment and to convert their Debentures into APUC common shares.


Related News

Related News

Energy Efficiency and Demand Response Can Nearly Level Southeast Electricity Demand for More than a Decade

Southeast Electricity Demand Forecast examines how energy efficiency, photovoltaics, electric vehicles, heat pumps, and demand response shape grid needs, stabilize load through 2030, shift peaks, and inform utility planning across the region.


Key Points

An outlook of load shaped by efficiency, solar, EVs, with demand response keeping usage steady through 2030.

✅ Stabilizes regional demand through 2030 under accelerated adoption

✅ Energy efficiency and demand response are primary levers

✅ EVs and heat pumps drive growth post 2030; shift winter peaks


Electricity markets in the Southeast are facing many changes on the customer side of the meter. In a new report released today, we look at how energy efficiency, photovoltaics (solar electricity), electric vehicles, heat pumps, and demand response (shifting loads from periods of high demand) might affect electricity needs in the Southeast.

We find that if all of these resources are pursued on an accelerated basis, electricity demand in the region can be stabilized until about 2030.

After that, demand will likely grow in the following decade because of increased market penetration of electric vehicles and heat pumps, but energy planners will have time to deal with this growth if these projections are borne out. We also find that energy efficiency and demand response can be vital for managing electricity supply and demand in the region and that these resources can help contain energy demand growth, reducing the impact of expensive new generation on consumer wallets.


National trends

This is the second ACEEE report looking at regional electricity demand. In 2016, we published a study on electricity consumption in New England, finding an even more pronounced effect. For New England, with even more aggressive pursuit of energy efficiency and these other resources, consumption was projected to decline through about 2030, before rebounding in the following decade.

These regional trends fit into a broader national pattern. In the United States, electricity consumption has been characterized by flat electricity demand for the past decade. Increased energy efficiency efforts have contributed to this lack of consumption growth, even as the US economy has grown since the Great Recession. Recently, the US Energy Information Administration (EIA – a branch of the US Department of Energy) released data on US electricity consumption in 2016, finding that 2016 consumption was 0.3% below 2015 consumption, and other analysts reported a 1% slide in 2023 on milder weather.


Five scenarios for the Southeast

ACEEE’s new study focuses on the Southeast because it is very different from New England, with warmer weather, more economic growth, and less-aggressive energy efficiency and distributed energy policies than the Northeast. For the Southeast, we examined five scenarios: a business-as-usual scenario; two alternative scenarios with progressively higher levels of energy efficiency, photovoltaics informed by a solar strategy for the South that is emerging regionally, electric vehicles, heat pumps, and demand response; and two scenarios combining high numbers of electric vehicles and heat pumps with more modest levels of the other resources. This figure presents electricity demand for each of these scenarios:

Over the 2016-2040 period, we project that average annual growth will range from 0.1% to 1.0%, depending on the scenario, much slower than historic growth in the region. Energy efficiency is generally the biggest contributor to changes in projected 2040 electricity consumption relative to the business-as-usual scenario, as shown in the figure below, which presents our accelerated scenario that is based on levels of energy efficiency and other resources now targeted by leading states and utilities in the Southeast.

To date, Entergy Arkansas has achieved the annual efficiency savings as a percent of sales shown in the accelerated scenario and Progress Energy (a division of Duke Energy) has nearly achieved those savings in both North and South Carolina. Sixteen states outside the Southeast have also achieved these savings statewide.

The efficiency savings shown in the aggressive scenario have been proposed by the Arkansas PSC. This level of savings has already been achieved by Arizona as well as six other states. Likewise, the demand response savings we model have been achieved by more than 10 utilities, including four in the Southeast. The levels of photovoltaic, electric vehicle, and heat pump penetration are more speculative and are subject to significant uncertainty.

We also examined trends in summer and winter peak demand. Most utilities in the Southeast have historically had peak demand in the summer, often seeing heatwave-driven surges that stress operations across the Eastern U.S., but our analysis shows that winter peaks will be more likely in the region as photovoltaics and demand response reduce summer peaks and heat pumps increase winter peaks.


Why it’s vital to plan broadly

Our analysis illustrates the importance of incorporating energy efficiency, demand response, and photovoltaics into utility planning forecasts as utility trends to watch continue to evolve. Failing to include these resources leads to much higher forecasts, resulting in excess utility system investments, unnecessarily increasing customer electricity rates. Our analysis also illustrates the importance of including electric vehicles and heat pumps in long-term forecasts. While these technologies will have moderate impacts over the next 10 years, they could become increasingly important in the long run.

We are entering a dynamic period of substantial uncertainty for long-term electricity sales and system peaks, highlighted by COVID-19 demand shifts that upended typical patterns. We need to carefully observe and analyze developments in energy efficiency, photovoltaics, electric vehicles, heat pumps, and demand response over the next few years. As these technologies advance, we can create policies to reduce energy bills, system costs, and harmful emissions, drawing on grid reliability strategies tested in Texas, while growing the Southeast’s economy. Resource planners should be sure to incorporate these emerging trends and policies into their long-term forecasts and planning.


Related News

View more

Kaspersky Lab Discovers Russian Hacker Infrastructure

Crouching Yeti APT targets energy infrastructure with watering-hole attacks, compromising servers to steal credentials and stage intrusions; Kaspersky Lab links the Energetic Bear group to ICS threats across Russia, US, Europe, and Turkey.


Key Points

Crouching Yeti APT, aka Energetic Bear, is a threat group that targets energy firms using watering-hole attacks.

✅ Targets energy infrastructure via watering-hole compromises

✅ Uses open-source tools and backdoored sshd for persistence

✅ Scans global servers to stage intrusions and steal credentials


A hacker collective known for attacking industrial companies around the world have had some of their infrastructure identified by Russian security specialists.

Kaspersky Lab said that it has discovered a number of servers compromised by the group, belonging to different organisations based in Russia, the US, and Turkey, as well as European countries.

The Russian-speaking hackers, known as Crouching Yeti or Energetic Bear, mostly focus on energy facilities, as seen in reports of infiltration of the U.S. power grid targeting critical infrastructure, for the main purpose of stealing valuable data from victim systems.


Hacked servers

Crouching Yeti is described as an advanced persistent threat (APT) group that Kaspersky Lab has been tracking since 2010.

#google#

Kaspersky Lab said that the servers it has compromised are not just limited to industrial companies. The servers were hit in 2016 and 2017 with different intentions. Some were compromised to gain access to other resources or to be used as intermediaries to conduct attacks on other resources.

Others, including those hosting Russian websites, were used as watering holes.

It is a common tactic for Crouching Yeti to utilise watering hole attacks where the attackers inject websites with a link redirecting visitors to a malicious server.

“In the process of analysing infected servers, researchers identified numerous websites and servers used by organisations in Russia, US, Europe, Asia and Latin America that the attackers had scanned with various tools, possibly to find a server that could be used to establish a foothold for hosting the attackers’ tools and to subsequently develop an attack,” said the security specialists in a blog posting.

“The range of websites and servers that captured the attention of the intruders is extensive,” the firm said. “Kaspersky Lab researchers found that the attackers had scanned numerous websites of different types, including online stores and services, public organisations, NGOs, manufacturing, etc.

Kaspersky Lab said that the hackers used publicly available malicious tools, designed for analysing servers, and for seeking out and collecting information. The researchers also found a modified sshd file with a preinstalled backdoor. This was used to replace the original file and could be authorised with a ‘master password’.

“Crouching Yeti is a notorious Russian-speaking group that has been active for many years and is still successfully targeting industrial organisations through watering hole attacks, among other techniques,” explained Vladimir Dashchenko, head of vulnerability research group at Kaspersky Lab ICS CERT.


Russian government?

“Our findings show that the group compromised servers not only for establishing watering holes, but also for further scanning, and they actively used open-sourced tools that made it much harder to identify them afterwards,” he said.

“The group’s activities, such as initial data collection, the theft of authentication data, and the scanning of resources, are used to launch further attacks,” said Dashchenko. “The diversity of infected servers and scanned resources suggests the group may operate in the interests of the third parties.”

This may well tie into a similar conclusion from a rival security vendor.

In 2014 CrowdStrike claimed that the ‘Energetic Bear’ group was also tracked in Symantec's Dragonfly research and had been hacking foreign companies on behalf of the Russian state.

The security vendor had said the group had been carrying out attacks on foreign companies since 2012, with reports of breaches at U.S. power plants that underscored the campaign, and there was evidence that these operations were sanctioned by the Russian government.

Last month the United States for the first time publicly accused Russia in a condemnation of Russian grid hacking of attacks against the American power grid.

Symantec meanwhile warned last year of a resurgence in cyber attacks on European and US energy companies, including reports of access to U.S. utility control rooms that could result in widespread power outages.

And last July the UK’s National Cyber Security Centre (NCSC) acknowledged it was investigating a broad wave of attacks on companies in the British energy and manufacturing sectors.


Related News

View more

EVs could drive 38% rise in US electricity demand, DOE lab finds

EV-Driven Electricity Demand Growth will reshape utilities through electrification, EV adoption, grid modernization, and ratebasing of charging, as NREL forecasts rising terawatt-hours, CAGR increases, and demand-side flexibility to manage emissions and reliability.


Key Points

Growth in power consumption fueled by EV adoption and electrification, increasing utility sales and grid investment.

✅ NREL projects 20%-38% higher U.S. load by 2050

✅ Utilities see CAGR up to 1.6% and 80 TWh/year growth

✅ Demand-side flexibility and EV charging optimize grids


Utilities have struggled with flat demand for years, but analysis by the National Renewable Energy Laboratory predicts steady growth across the next three decades — largely driven by the adoption of electric vehicles, including models like the Tesla Model 3 that are reshaping expectations.

The study considers three scenarios, a reference case and medium- and high-adoption electrification predictions. All indicate demand growth, but in the medium and high scenarios for 2050, U.S. electricity consumption increases by 20% and 38%, respectively, compared to business as usual.

Utilities could go from stagnant demand to compound annual growth rates of 1.6%, which would amount to sustained absolute growth of 80 terawatt-hours per year.

"This unprecedented absolute growth in annual electricity consumption can significantly alter supply-side infrastructure development requirements," the report says, and could challenge state power grids in multiple regions.

NREL's Trieu Mai, principal investigator for the study, cautions that more research is needed to fully assess the drivers and impacts of electrification, "as well as the role and value of demand-side flexibility."

"Although we extensively and qualitatively discuss the potential drivers and barriers behind electric technology adoption in the report, much more work is needed to quantitatively understand these factors," Mai said in a statement.

However, utilities have largely bought into the dream.

"Electric vehicles are the biggest opportunity we see right now," Energy Impact Partners CEO Hans Kobler told Utility Dive. And the impact could go beyond just higher kilowattt-hour sales, particularly as electric truck fleets come online.

"When the transportation sector is fully electrified, it will result in around $6 trillion in investment," Kobler said. "Half of that is on the infrastructure side of the utility." And the industry can also benefit through ratebasing charging stations and managing the new demand.

One benefit that NREL's report points to is the possibility of "expanded value streams enabled by electric and/or grid-connected technologies," such as energy storage and mobile chargers that enhance flexibility.

"Many electric utilities are carefully watching the trend toward electrification, as it has the potential to increase sales and revenues that have stagnated or fallen over the past decade," the report said, highlighting potential benefits for all customers as adoption grows. "Beyond power system planning, other motivations to study electrification include its potential to impact energy security, emissions, and innovation in electrical end-use technologies and overall efficient system integration. The impacts of electrification could be far-reaching and have benefits and costs to various stakeholders."


Related News

View more

California just made more clean energy than it needed

CAISO Net Negative Emissions signal moments when greenhouse gas intensity of serving ISO demand drops below zero, driven by high renewable generation, low load, strong solar exports, and imports accounting in the California grid.


Key Points

Moments when CAISO's CO2 to serve demand is below zero, driven by renewables, exports, and import accounting.

✅ Calculated using imports and exports to serve ISO demand

✅ Occur during high solar output, low weekend load

✅ Coincide with curtailment and record renewable penetration


We’re a long way from the land of milk and honey, but on Easter Sunday – for about an hour – we got a taste.

On Sunday, at 1:55 PM Pacific Time the California Independent Systems Operator (CAISO) reported that greenhouse gas emissions necessary to serve its demand (~80% of California’s electricity demand on an annual basis), was measured at a rate -16 metric tons of CO2 per hour. Five minutes later, the value was -2 mTCO2/h, before it crept back up to 40 mTCO2/h at 2:05 PM PST. At 2:10 PST though it fell back to -86 mTCO2/h and stayed negative until 3:05 PM PST, even as global CO2 emissions flatlined in 2019 according to the IEA.

This information was brought to the attention of pv magazine via tweet from eagle eye Jon Pa after CAISO’s site first noted the negative values:

The region was still generating CO2 though, as natural gas, biogas, biomass, geothermal and even coal plants were running and pumping out emissions, even as potent greenhouse gases declined in the US under control efforts. CAISO’s Greenhouse Gas Emission Tracking Methodology, December 28, 2016 (pdf) notes the below calculations to create the value what it terms, “Total GHG emissions to serve ISO demand”:

Of importance to note is that to get to the net negative value, CAISO considered all electricity imports and exports, a reminder that climate policy shapes grid operations across North America. And as can be noted in the image below the CO2 intensity of imports during the day rapidly declined as the sun came up, first going negative around 9:05 AM PST, and mostly staying so until just before 6 PM PST.

During this same weekend, other records were noted (reiterating that we’re in record setting season and as the state pursues its 100% carbon-free mandate now in law) such as a new electricity export record of greater than 2 GW and total renewable electricity as part of total demand at greater than 70%.

At the peak negative moment of 2:15 PM PST, -112 mTCO2/h seen below, the total amount of clean instantaneous generation being used in the power grid region was 17 GW, a far cry from heat-driven reliability strains like rolling blackout warnings that arise during extreme demand, with renewables giving 76% of the total, hydro 14%, nuclear 13% and imports of -12% countering the CO2 coming from just over 1.4 GW of gas generation.

Also of importance are a few layers of nuance in the electricity demand charts. First off we’re in the shoulder seasons  of California – nice cool weather before the warmth of summer drives air conditioning demand. Additional the weekend electricity demand is always lower, as well, Easter Sunday might have had an affect, whereas in colder regions Calgary’s electricity use can soar during frigid snaps.

Lastly to note was the amount of electricity from solar and wind generation being curtailed. And while the Sunday numbers weren’t available yet, the below image noted Saturday with 10 GWh in total being curtailed (pdf) – peaking at over 3.2 GW of instantaneous mostly solar power even as solar is now the cheapest electricity according to the IEA, in the hours of 2 and 3 PM PST. On an annualized basis, less than 2% of total potential solar electricity was curtailed in 2018.


Related News

View more

Americans Keep Using Less and Less Electricity

U.S. Electricity Demand Decoupling signals GDP growth without higher load, driven by energy efficiency, LED adoption, services-led output, and rising renewables integration with the grid, plus EV charging and battery storage supporting decarbonization.


Key Points

GDP grows as electricity use stays flat, driven by efficiency, renewables, and a shift toward services and output.

✅ LEDs and codes cut residential and commercial load intensity.

✅ Wind, solar, and gas gain share as coal and nuclear struggle.

✅ EVs and storage can grow load and enable grid decarbonization.


By Justin Fox

Economic growth picked up a little in the U.S. in 2017. But electricity use fell, with electricity sales projections continuing to decline, according to data released recently by the Energy Information Administration. It's now been basically flat for more than a decade:


Measured on a per-capita basis, electricity use is in clear decline, and is already back to the levels of the mid-1990s.


Sources: U.S. Energy Information Administration, U.S. Bureau of Economic Analysis

*Includes small-scale solar generation from 2014 onward


I constructed these charts to go all the way back to 1949 in part because I can (that's how far back the EIA data series goes) but also because it makes clear what a momentous change this is. Electricity use rose and rose and rose and then ... it didn't anymore.

Slower economic growth since 2007 has been part of the reason, but the 2017 numbers make clear that higher gross domestic product no longer necessarily requires more electricity, although the Iron Law of Climate is often cited to suggest rising energy use with economic growth. I wrote a column last year about this big shift, and there's not a whole lot new to say about what's causing it: mainly increased energy efficiency (driven to a remarkable extent by the rise of LED light bulbs), and the continuing migration of economic activity away from making tangible things and toward providing services and virtual products such as games and binge-watchable TV series (that are themselves consumed on ever-more-energy-efficient electronic devices).

What's worth going over, though, is what this means for those in the business of generating electricity. The Donald Trump administration has made saving coal-fired electric plants a big priority; the struggles of nuclear power plants have sparked concern from multiple quarters. Meanwhile, U.S. natural gas production has grown by more than 40 percent since 2007, thanks to hydraulic fracturing and other new drilling techniques, while wind and solar generation keep making big gains in cost and market share. And this is all happening within the context of a no-growth electricity market.

In China, a mystery in China's electricity data has complicated global comparisons.


Here are the five main sources of electric power in the U.S.:


The big story over the past decade has been coal and natural gas trading places as the top fuel for electricity generation. Over the past year and a half coal regained some of that lost ground as natural gas prices rose from the lows of early 2016. But with overall electricity use flat and production from wind and solar on the rise, that hasn't translated into big increases in coal generation overall.

Oh, and about solar. It's only a major factor in a few states (California especially), so it doesn't make the top five. But it's definitely on the rise.


What happens next? For power generators, the best bet for breaking out of the current no-growth pattern is to electrify more of the U.S. economy, especially transportation. A big part of the attraction of electric cars and trucks for policy-makers and others is their potential to be emissions-free. But they're only really emissions-free if the electricity used to charge them is generated in an emissions-free manner -- creating a pretty strong business case for continuing "decarbonization" of the electric industry. It's conceivable that electric car batteries could even assist in that decarbonization by storing the intermittent power generated by wind and solar and delivering it back onto the grid when needed.

I don't know exactly how all this will play out. Nobody does. But the business of generating electricity isn't going back to its pre-2008 normal. 


Related News

View more

PG&E Supports Local Communities as It Pays More Than $230 Million in Property Taxes to 50 California Counties

PG&E property tax payments bolster counties, education, public safety, and infrastructure across Northern and Central California, reflecting semi-annual levies tied to utility assets, capital investments, and economic development that serve 16 million customers.


Key Points

PG&E property tax payments are semi-annual county taxes funding public services and linked to utility infrastructure.

✅ $230M paid for Jul-Dec 2017 across 50 California counties

✅ Estimated $461M for FY 2017-2018, up 12% year over year

✅ Investments: $5.9B in grid, Gas Safety Academy, control center


Pacific Gas and Electric Company (PG&E) paid property taxes of more than $230 million this fall to the 50 counties where the energy company owns property and operates gas and electric infrastructure that serves 16 million Californians. The tax payments help support essential public services like education and public health and safety actions across the region.

The semi-annual property tax payments made today cover the period from July 1 to December 31, 2017.

Total payments for the full tax year of July 1, 2017 to June 30, 2018 are estimated to total more than $461 million—an increase of $50 million, or 12 percent, compared with the prior fiscal year, even as customer rates are expected to stabilize in the years ahead.

“Property tax payments provide crucial resources to the many communities where we live and work, supporting everything from education to public safety. By continuing to make local investments in gas and electric infrastructure, we are not only creating one of the safest and most reliable energy systems in the country, including wildfire risk reduction programs and related efforts, we’re investing in the local economy and helping our communities thrive,” said Jason Wells, senior vice president and chief financial officer for PG&E.

PG&E invested more than $5.7 billion last year and expects to invest $5.9 billion this year to enhance and upgrade its gas and electrical infrastructure amid power line fire risks across Northern and Central California.

Some recent investments include the construction of PG&E’s $75 millionGas Safety Academy in Winters in Yolo County, which opened in September. Last year, PG&E opened a $36 million, state-of-the-art electric distribution control center in Rocklin.

PG&E supports the communities it serves in a variety of ways. In 2016, PG&E provided more than $28 million in charitable contributions to enrich local educational opportunities, preserve the environment, and support economic vitality and emergency preparedness and safety, including its Wildfire Assistance Program for impacted residents. PG&E employees provide thousands of hours of volunteer service in their local communities. The company also offers a broad spectrum of economic development services to help local businesses grow.


Related News

View more

Sign Up for Electricity Forum’s Newsletter

Stay informed with our FREE Newsletter — get the latest news, breakthrough technologies, and expert insights, delivered straight to your inbox.

Electricity Today T&D Magazine Subscribe for FREE

Stay informed with the latest T&D policies and technologies.
  • Timely insights from industry experts
  • Practical solutions T&D engineers
  • Free access to every issue

Live Online & In-person Group Training

Advantages To Instructor-Led Training – Instructor-Led Course, Customized Training, Multiple Locations, Economical, CEU Credits, Course Discounts.

Request For Quotation

Whether you would prefer Live Online or In-Person instruction, our electrical training courses can be tailored to meet your company's specific requirements and delivered to your employees in one location or at various locations.