Arvato commissions first solar power plant


Substation Relay Protection Training

Our customized live online or in‑person group training can be delivered to your staff at your location.

  • Live Online
  • 12 hours Instructor-led
  • Group Training Available
Regular Price:
$699
Coupon Price:
$599
Reserve Your Seat Today

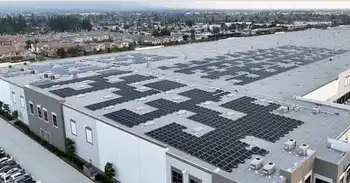
Arvato Ontario Solar Power Plant advances sustainability with rooftop photovoltaic panels, PPA financing, and green electricity, generating 800,000 kWh annually to cut logistics emissions, reduce energy costs, and support carbon-neutral supply chain operations.


Key Points

A rooftop PV system under a PPA, supplying low-cost green power to Arvato's Ontario, CA distribution center.

✅ 1,160 panels produce 800,000 kWh of renewable power yearly

✅ PPA model avoids upfront costs and lowers electricity rates

✅ Cuts center emissions by 72%; 45% roof coverage


Arvato continues to invest consistently in the sustainability of its distribution centers. To this end, the first solar power plant in the focus market has now been commissioned on the roof of the distribution center in Ontario, California. The solar power plant has 1,160 solar panels and generates more than 800,000 kilowatt hours (kWh) of green electricity annually. This reduces electricity costs and, with advances in battery storage, further cuts the logistics center's greenhouse gas emissions. Previously, the international supply chain and e-commerce service provider had converted five other distribution centers in the USA to green electricity.

The project started as early as November 2019 with an intensive site investigation. An extensive catalogue of measures and criteria had to be worked through to install and commission the solar power plant on the roof system. After a rigorous process involving numerous stakeholders, the new solar modules were installed in August 2022, similar to utility-scale deployments like the largest solar array in Washington seen recently. However, further approvals and permits were required before the solar system could be officially commissioned, a common step for solar power plants worldwide. Once official permission for the operation was granted, the switch could be flipped in February 2023, and production of environmentally friendly solar electricity could begin.

The photovoltaic system is operated under a Purchase Power Agreement (PPA), a model widely used in corporate renewable energy projects today. This unique financing mechanism is available in twenty-six U.S. states, including California. While a third-party developer installs, owns and operates the solar panels, Arvato purchases the electricity generated. This allows companies in the U.S. to support clean energy projects while buying low-cost electricity without having to finance upfront costs. "The PPA and the resulting benefits were quite critical to the success of this project," says Christina Greenwell, Microsoft AOC F&L Client Services Manager at Arvato, who managed the project from start to finish. "It allows us to reduce our electricity costs while supporting Bertelsmann's ambitious goal of becoming carbon neutral by 2030."

The 1,160 solar panels were added to an existing system of 920 panels owned by the logistics center's landlord. In total, the panels now cover 45 percent of the roof space at the Ontario distribution center. The emissions generated by the distribution center are now reduced by 72 percent with the new solar panels and clean power generation. As Bertelsmann plans to switch all its sites worldwide to 100 percent green electricity, renewable energy certificates will, as seen when Bimbo Canada signed agreements to offset 100 percent of its electricity for its operations, offset the remaining emissions.

"The new solar power plant is a significant step on our path to carbon neutrality and demonstrates our commitment to finding innovative solutions that reduce our carbon footprint," said Mitat Aydindag, President of North America at Arvato. "All employees at the site are pleased that our Ontario distribution center is now a pioneer and is providing effective support in achieving our ambitious climate goal in 2030."

Similar facility-level efforts include the Bright Feeds Berlin solar project underscoring momentum across industrial operations.


Related News

Related News

The N.L. government is pushing the electric car but Labrador's infrastructure is lagging behind

Labrador EV Charging Infrastructure faces gaps, with few fast chargers; Level 2 dominates, fueling range anxiety for Tesla and Chevrolet Bolt drivers, despite rebates and Newfoundland's network linking St. John's to Port aux Basques.


Key Points

It refers to the current and planned network of Level 2 and Level 3 charging sites across Labrador.

✅ 2 public Level 2 chargers: Happy Valley-Goose Bay and Churchill Falls

✅ Phase 2: 3 fast chargers planned for HV-GB, Churchill Falls, Labrador City

✅ $2,500 rebates offered; rural range anxiety still deters buyers


Retired pilot Allan Carlson is used to crossing Labrador by air.

But he recently traversed the Big Land in an entirely new way, driving for hours on end in his electric car.

The vehicle in question is a Tesla Model S P100D, which Carlson says he can drive up to 500 kilometres on a full charge — and sometimes even a little more.

After catching a ferry to Blanc-Sablon, Que., earlier this month, he managed to reach Happy Valley-Goose Bay, over 600 kilometres away.

To get there, though, he had to use the public charging station in Blanc-Sablon. He also had to push the limits of what his car could muster. 

But more affordable mass-market electric vehicles don't have the battery power of a top-of-the-range Tesla, prompting the Big Land's first EV owner to wonder when Labrador infrastructure will catch up to the high-speed charging network recently unveiled across Newfoundland this summer.

Phillip Rideout, an electrician who lives in Nain, bought a Chevrolet Bolt EV for his son — the range of which tops out at under 350 kilometres, depending on driving patterns and weather conditions.

He's comfortable driving the car within Nain but said he's concerned about traveling to southern Labrador on a single charge.

"It's a start in getting these 14 charging stations across the island," Rideout said of Newfoundland's new network, "but there is still more work to be done."

The provincial government continues to push an electric-vehicle future, however, even as energy efficiency rankings trail the national average, despite Labradorians like Rideout feeling left out of the loop.

Bernard Davis, minister of environment and climate change, earlier this month announced that government is accepting applications for its electric-vehicle rebate program, as the N.W.T. EV initiative pursues similar goals.

Under the $500,000 program, anyone looking to buy a new or used EV would be entitled to $2,500 in rebates, an attempt by the provincial government to increase EV adoption.

But according to a survey conducted this year by polling firm Leger for the Canadian Vehicle Manufacturer's Association, 51 per cent of rural Canadians found a lack of fast-charging public infrastructure to be a major deterrent to buying an electric car, even as Atlantic EV interest lags overall, according to recent data.

While Newfoundland's 14-charger network, operated by N.L. Hydro and Newfoundland Power, allows drivers to travel from St. John's to Port aux Basques, and 10 new fast-charging stations are planned along the Trans-Canada in New Brunswick, Labrador in contrast has just two publicly available charging locations: one at the YMCA in Happy Valley-Goose Bay and the other near the town office of Churchill Falls.

This is the proposed second phase of additional Level 2 and Level 3 charging locations across Labrador. (TakeChargeNL)
These are slower, Level 2 chargers, as opposed to newer Level 3 charging stations on the island. A Level 2 system averages 50 kilometres of range per hour, and a Level 3 systems can add up to 250 kilometres within the same time frame, making them about five times faster.

Even though all of the fast-charging stations have gone to Newfoundland, MHA for Lake Melville Perry Trimper is optimistic about Labrador's electric future.

Trimper has owned an EV in St. Johns since 2016, but told CBC he'd be comfortable driving it in Happy Valley-Goose Bay.

He acknowledged, however, that prospective owners in Labrador might not be able to drive far from their home charging outlet. 

More promises
If rural skepticism driven by poor infrastructure continues, the urban population could lead the way in adoption, allowing the new subsidies to disproportionately go toward larger population centres, Davis acknowledged.

"Obviously people are not going to purchase electric vehicles if they don't believe they can charge them where they want to be or where they want to go," Davis said in an interview in early September.

Under the provincial government's Phase 2 proposal, Newfoundland and Labrador is projected to get 19 charging stations, with three going to Labrador in Happy Valley-Goose Bay, Churchill Falls and Labrador City, taking cues from NB Power's public network in building regional coverage.

Davis would not commit to a specific cutoff period for the rebate program or a timeline for the first fast-charging stations in Labrador to be built.

"At some point, we are not going to need to place any subsidy on electric vehicles," he said, "but that time is not today and that's why these subsidies are important right now."

Future demand 
Goose Bay Motors manager Joel Hamlen thinks drivers in Labrador could shift away from gas vehicles eventually, even as EV shortages and wait times persist.

But he says it'll take investment into a charging network to get there.

"If we can get something set up where these people can travel down the roads and use these vehicles in the province … I am sure there will be even more of a demand," Hamlen said.


Related News

View more

Electric Cars 101: How EV Motors Work, Tech Differences, and More

Electric Car Motors convert electricity to torque via rotor-stator magnetic fields, using AC/DC inverters, permanent magnets or induction designs; they power EV powertrains efficiently and enable regenerative braking for energy recovery and control.


Key Points

Electric car motors turn electrical energy into wheel torque using rotor-stator fields, inverters, and AC or DC control.

✅ AC induction, PMSM, BLDC, and reluctance architectures explained

✅ Inverters manage AC/DC, voltage, and motor speed via frequency

✅ Regenerative braking recovers energy and reduces wear


When was the last time you stopped to think about how electric cars actually work, especially if you're wondering whether to buy an electric car today? We superfans of the car biz have mostly developed a reasonable understanding of how combustion powertrains work. Most of us can visualize fuel and air entering a combustion chamber, exploding, pushing a piston down, and rotating a crankshaft that ultimately turns the wheels. We generally understand the differences between inline, flat, vee-shaped, and maybe even Wankel rotary combustion engines.

Mechanical engineering concepts such as these are comparatively easy to comprehend. But it's probably a fair bet to wager that only a minority of folks reading this can explain on a bar napkin exactly how invisible electrons turn a car's wheels or how a permanent-magnet motor differs from an AC induction one. Electrical engineering can seem like black magic and witchcraft to car nuts, so it's time to demystify this bold new world of electromobility, with the age of electric cars arriving ahead of schedule.

How Electric Cars Work: Motors
It has to do with magnetism and the natural interplay between electric fields and magnetic fields. When an electrical circuit closes allowing electrons to move along a wire, those moving electrons generate an electromagnetic field complete with a north and a south pole. When this happens in the presence of another magnetic field—either from a different batch of speeding electrons or from Wile E. Coyote's giant ACME horseshoe magnet, those opposite poles attract, and like poles repel each other.


Electric motors work by mounting one set of magnets or electromagnets to a shaft and another set to a housing surrounding that shaft. By periodically reversing the polarity (swapping the north and south poles) of one set of electromagnets, the motor leverages these attracting and repelling forces to rotate the shaft, thereby converting electricity into torque and ultimately turning the wheels, in a sector where the electric motor market is growing rapidly worldwide. Conversely—as in the case of regenerative braking—these magnetic/electromagnetic forces can transform motion back into electricity.

How Electric Cars Work: AC Or DC?
The electricity supplied to your home arrives as alternating current (AC), and bidirectional charging means EVs can power homes for days as needed, so-called because the north/south or plus/minus polarity of the power changes (alternates) 60 times per second. (That is, in the United States and other countries operating at 110 volts; countries with a 220-volt standard typically use 50-Hz AC.) Direct current (DC) is what goes into and comes out of the + and - poles of every battery. As noted above, motors require alternating current to spin. Without it, the electromagnetic force would simply lock their north and south poles together. It's the cycle of continually switching north and south that keeps a motor spinning.


Today's electric cars are designed to manage both AC and DC energy on board. The battery stores and dispenses DC current, but again, the motor needs AC. When recharging the battery, and with increasing grid coordination enabling flexibility, the energy comes into the onboard charger as AC current during Level 1 and Level 2 charging and as DC high-voltage current on Level 3 "fast chargers." Sophisticated power electronics (which we will not attempt to explain here) handle the multiple onboard AC/DC conversions while stepping the voltage up and down from 100 to 800 volts of charging power to battery/motor system voltages of 350-800 volts to the many vehicle lighting, infotainment, and chassis functions that require 12-48-volt DC electricity.

How Electric Cars Work: What Types Of Motors?
DC Motor (Brushed): Yes, we just said AC makes the motor go around, and these old-style motors that powered early EVs of the 1900s are no different. DC current from the battery is delivered to the rotor windings via spring-loaded "brushes" of carbon or lead that energize spinning contacts connected to wire windings. Every few degrees of rotation, the brushes energize a new set of contacts; this continually reverses the polarity of the electromagnet on the rotor as the motor shaft turns. (This ring of contacts is known as the commutator).

The housing surrounding the rotor's electromagnetic windings typically features permanent magnets. (A "series DC" or so-called "universal motor" may use an electromagnetic stator.) Advantages are low initial cost, high reliability, and ease of motor control. Varying the voltage regulates the motor's speed, while changing the current controls its torque. Disadvantages include a lower lifespan and the cost of maintaining the brushes and contacts. This motor is seldom used in transportation today, save for some Indian railway locomotives.

Brushless DC Motor (BLDC): The brushes and their maintenance are eliminated by moving the permanent magnets to the rotor, placing the electromagnets on the stator (housing), and using an external motor controller to alternately switch the various field windings from plus to minus, thereby generating the rotating magnetic field.

Advantages are a long lifespan, low maintenance, and high efficiency. Disadvantages are higher initial cost and more complicated motor speed controllers that typically require three Hall-effect sensors to get the stator-winding current phased correctly. That switching of the stator windings can result in "torque ripple"—periodic increases and decreases in the delivered torque. This type of motor is popular for smaller vehicles like electric bikes and scooters, and it's used in some ancillary automotive applications like electric power steering assist.


Permanent-Magnet Synchronous Motor (PMSM): Physically, the BLDC and PMSM motors look nearly identical. Both feature permanent magnets on the rotor and field windings in the stator. The key difference is that instead of using DC current and switching various windings on and off periodically to spin the permanent magnets, the PMSM functions on continuous sinusoidal AC current. This means it suffers no torque ripple and needs only one Hall-effect sensor to determine rotor speed and position, so it's more efficient and quieter.

The word "synchronous" indicates the rotor spins at the same speed as the magnetic field in the windings. Its big advantages are its power density and strong starting torque. A main disadvantage of any motor with spinning permanent magnets is that it creates "back electromotive force" (EMF) when not powered at speed, which causes drag and heat that can demagnetize the motor. This motor type also sees some duty in power steering and brake systems, but it has become the motor design of choice in most of today's battery electric and hybrid vehicles.


Note that most permanent-magnet motors of all kinds orient their north-south axis perpendicular to the output shaft. This generates "radial (magnetic) flux." A new class of "axial flux" motors orients the magnets' N-S axes parallel to the shaft, usually on pairs of discs sandwiching stationary stator windings in between. The compact, high-torque axial flux orientation of these so-called "pancake motors" can be applied to either BLDC or PMSM type motors.


AC Induction: For this motor, we toss out the permanent magnets on the rotor (and their increasingly scarce rare earth materials) and keep the AC current flowing through stator windings as in the PMSM motor above.

Standing in for the magnets is a concept Nikola Tesla patented in 1888: As AC current flows through various windings in the stator, the windings generate a rotating field of magnetic flux. As these magnetic lines pass through perpendicular windings on a rotor, they induce an electric current. This then generates another magnetic force that induces the rotor to turn. Because this force is only induced when the magnetic field lines cross the rotor windings, the rotor will experience no torque or force if it rotates at the same (synchronous) speed as the rotating magnetic field.

This means AC induction motors are inherently asynchronous. Rotor speed is controlled by varying the alternating current's frequency. At light loads, the inverter controlling the motor can reduce voltage to reduce magnetic losses and improve efficiency. Depowering an induction motor during cruising when it isn't needed eliminates the drag created by a permanent-magnet motor, while dual-motor EVs using PMSM motors on both axles must always power all motors. Peak efficiency may be slightly greater for BLDC or PMSM designs, but AC induction motors often achieve higher average efficiency. Another small trade-off is slightly lower starting torque than PMSM. The GM EV1 of the mid-1990s and most Teslas have employed AC Induction motors, despite skepticism about an EV revolution in some quarters.


Reluctance Motor: Think of "reluctance" as magnetic resistance: the degree to which an object opposes magnetic flux. A reluctance motor's stator features multiple electromagnet poles—concentrated windings that form highly localized north or south poles. In a switched reluctance motor (SRM), the rotor is made of soft magnetic material such as laminated silicon steel, with multiple projections designed to interact with the stator's poles. The various electromagnet poles are turned on and off in much the same way the field windings in a BLDC motor are. Using an unequal number of stator and rotor poles ensures some poles are aligned (for minimum reluctance), while others are directly in between opposite poles (maximum reluctance). Switching the stator polarity then pulls the rotor around at an asynchronous speed.


A synchronous reluctance motor (SynRM) doesn't rely on this imbalance in the rotor and stator poles. Rather, SynRM motors feature a more distributed winding fed with a sinusoidal AC current as in a PMSM design, with speed regulated by a variable-frequency drive, and an elaborately shaped rotor with voids shaped like magnetic flux lines to optimize reluctance.

The latest trend is to place small permanent magnets (often simpler ferrite ones) in some of these voids to take advantage of both magnetic and reluctance torque while minimizing cost and the back EMF (or counter-electromotive force) high-speed inefficiencies that permanent-magnet motors suffer.

Advantages include lower cost, simplicity, and high efficiency. Disadvantages can include noise and torque ripple (especially for switched reluctance motors). Toyota introduced an internal permanent-magnet synchronous reluctance motor (IPM SynRM) on the Prius, and Tesla now pairs one such motor with an AC induction motor on its Dual Motor models. Tesla also uses IPM SynRM as the single motor for its rear-drive models.


Electric motors may never sing like a small-block or a flat-plane crank Ferrari. But maybe, a decade or so from now, we'll regard the Tesla Plaid powertrain as fondly as we do those engines, even as industry leaders note that mainstream adoption faces hurdles, and every car lover will be able to describe in intimate detail what kind of motors it uses.


Related News

View more

Requests for Proposal launched for purchase of clean electricity in Alberta

Canada Clean Electricity Procurement advances federal operations with renewable energy in Alberta, leveraging RECs, competitive sourcing, Indigenous participation, and grid decarbonization to cut greenhouse gas emissions and stimulate new clean power infrastructure.


Key Points

A plan to procure clean power and RECs, cutting emissions in Alberta and attributing use where renewables are absent.

✅ RFPs to source new clean electricity in Alberta

✅ RECs from net new Canadian renewable generation

✅ Mandatory Indigenous participation via equity or set-asides


Public Services and Procurement Canada (PSPC) is taking concrete steps to meet the Government of Canada's commitment in the Greening Government Strategy to reduce greenhouse gas emissions from federal government buildings, vehicle fleets and other operations, aligning with broader vehicle electrification trends across Canada.

The Honourable Anita Anand, Minister of Public Services and Procurement, announced the Government of Canada has launched Requests for Proposal to buy new clean electricity in the province of Alberta, which is moving ahead with the retirement of coal power to clean its grid, to power federal operations there.

As well, Canada will purchase Renewable Energy Certificates (REC) from new clean energy generation in Canada. This will enable Canada to attribute its energy consumption as clean in regions where new clean renewable sources are not yet available. The Government of Canada is excited about this opportunity to stimulate net new Canadian clean electricity generation through the procurement of RECs and complementary power purchase agreements that secure long-term supply for federal demand.

Together, these contracts will help to ensure Canada is reducing its greenhouse gas footprint by approximately 133 kilotonnes or 56% of total real property emissions in Alberta. Additionally, the contracts will displace approximately 41 kilotonnes of greenhouse gas emissions from electricity use in the rest of Canada, supporting progress toward 2035 clean electricity goals even as challenges remain.

Through these open, fair and transparent competitive procurement processes, PSPC will be a key purchaser of clean electricity and will support the growth of new clean electricity and renewable power infrastructure, such as recent turbine investments in Manitoba that expand capacity.

The Government of Canada's Clean Electricity Initiative plans to use 100% clean electricity by 2022, where available, in alignment with evolving net-zero electricity regulations that shape supply choices, to reduce greenhouse gas emissions and stimulate growth in clean renewable power infrastructure. PSPC has applied the goals of the Government of Canada's Clean Electricity Initiative to its specific requirement for net new clean electricity generation to power federal operations in Alberta.  

These procurements will support economic opportunities for Indigenous businesses by encouraging participation in the move towards clean energy, seen in provincial shifts toward clean power in Ontario that broaden markets. Each Request for Proposal incorporates mandatory requirements for Indigenous participation through equity holdings or set-asides under the Procurement Strategy for Aboriginal Business.


Related News

View more

Is residential solar worth it?

Home Solar Cost vs Utility Bills compares electricity rates, ROI, incentives, and battery storage, explaining payback, financing, and grid fees while highlighting long-term savings, rate volatility, and backup power resilience for homeowners.


Key Points

Compares home solar pricing and financing to utility rates, outlining savings, incentives, ROI, and backup power value.

✅ Average retail rates rose 59% in 20 years; volatility persists

✅ Typical 7.15 kW system costs $18,950 before incentives

✅ Federal ITC and state rebates improve ROI and payback


When shopping for a home solar system, sometimes the quoted price can leave you wondering why someone would move forward with something that seems so expensive. 

When compared with the status quo, electricity delivered from the utility, the price may not seem so high after all. First, pv magazine will examine the status quo, and how much you can expect to pay for power if you don’t get solar panels. Then, we will examine the average cost of solar arrays today and introduce incentives that boost home solar value.

The cost of doing nothing

Generally, early adopters have financially benefited from going solar by securing price certainty and stemming the impact of steadily increasing utility-bill costs, particularly for energy-insecure households who pay more for electricity.

End-use residential electric customers pay an average of $0.138/kWh in the United States, according to the Energy Information Administration (EIA). In California, that rate is $0.256/kWh, it averages $0.246/kWh across New England, $0.126/kWh in the South Atlantic region, and $0.124/kWh in the Mountain West region.

EIA reports that the average home uses 893 kWh per month, so based on the average retail rate of $0.138/kWh, that’s an electric bill of about $123 monthly, or $229 monthly in California.

Over the last 20 years, EIA data show that retail electricity prices have increased 59% across the United States, with evidence indicating that renewables are not making electricity more expensive, suggesting other factors have driven costs higher, or 2.95% each year.

This means based on historical rates, the average US homeowner can expect to pay $39,460 over the next 20 years on electricity bills. On average, Californians could pay $73,465 over 20 years.

Recent global events show just how unstable prices can be for commodities, and energy is no exception here, with solar panel sales doubling in the UK as homeowners look to cut soaring bills. What will your utility bill cost in 20 years?

These estimated bills also assume that energy use in the home is constant over 20 years, but as the United States electrifies its homes, adds more devices, and adopts electric vehicles, it is fair to expect that many homeowners will use more electricity going forward.

Another factor that may exacerbate rate raising is the upgrade of the national transmission grid. The infrastructure that delivers power to our homes is aging and in need of critical upgrades, and it is estimated that a staggering $500 billion will be spent on transmission buildout by 2035. This half-trillion-dollar cost gets passed down to homeowners in the form of raised utility bill rates.

The benefit of backup power may increase as time goes on as well. Power outages are on the rise across the United States, and recent assessments of the risk of power outages underscore that outages related to severe weather events have doubled in the last 20 years. Climate change-fueled storms are expected to continue to rise, so the role of battery backup in providing reliable energy may increase significantly.

The truth is, we don’t know how much power will cost in 20 years. Though it has increased 59% across the nation in the last 20 years, there is no way to be certain what it will cost going forward. That is where solar has a benefit over the status quo. By purchasing solar, you are securing price certainty going forward, making it easier to budget and plan for the future.

So how do these costs compare to going solar?

Cost of solar

As a general trend, prices for solar have fallen. In 2010, it cost about $40,000 to install a residential solar system, and since then, prices have fallen by as much as 70%, and about 37% in the last five years. However, prices have increased slightly in 2022 due to shipping costs, materials costs, and possible tariffs being placed on imported solar goods, and these pressures aren’t expected to be alleviated in the near-term.

When comparing quotes, the best metric for an apples-to-apples comparison is the cost per watt. Price benchmarking by the National Renewable Energy Laboratory shows the average cost per watt for the nation was $2.65/W DC in 2021, and the average system size was 7.15 kW. So, an average system would cost about $18,950. With 12.5 kWh of battery energy storage, the average cost was $4.26/W, representing an average price tag of $30,460 with batteries included.

The prices above do not include any incentives. Currently, the federal government applies a 26% investment tax credit to the system, bringing down system costs for those who qualify to $14,023 without batteries, and $22,540 with batteries. Compared to the potential $39,460 in utility bills, buying a solar system outright in cash appears to show a clear financial benefit.

Many homeowners will need financing to buy a solar system. Shorter terms can achieve rates as low as 2.99% or less, but financing for a 20-year solar loan typically lands between 5% to 8% or more. Based on 20-year, 7% annual percentage rate terms, a $14,000 system would total about $26,000 in loan payments over 20 years, and the system with batteries included would total about $42,000 in loan payments.

Often when you adopt solar, the utility will still charge you a grid access fee even if your system produces 100% of your needs. These vary from utility to utility but are often around $10 a month. Over 20 years, that equates to about $2,400 that you’ll still need to pay to the utility, plus any costs for energy you use beyond what your system provides.

Based on these average figures, a homeowner could expect to see as much as $12,000 in savings with a 20-year financed system. Homeowners in regions whose retail energy price exceeds the national average could see savings in multiples of that figure.

Though in this example batteries appear to be marginally more expensive than the status quo over a 20-year term, they improve the home by adding the crucial service of backup power, and as battery costs continue to fall they are increasingly being approved to participate in grid services, potentially unlocking additional revenue streams for homeowners.

Another thing to note is most solar systems are warranted for 25 years rather than the 20 used in the status quo example. A panel can last a good 35 years, and though it will begin to produce less in old age, any power produced by a panel you own is money back in your pocket.

Incentives and home value

Many states have additional incentives to boost the value of solar, too, and federal proposals to increase solar generation tenfold could remake the U.S. electricity system. Checking the Database of State Incentives for Renewables (DSIRE) will show the incentives available in your state, and a solar representative should be able to walk you through these benefits when you receive a quote. State incentives change frequently and vary widely, and in some cases are quite rich, offering thousands of dollars in additional benefits.

Another factor to consider is home value. A study by Zillow found that solar arrays increase a home value by 4.1% on average. For a $375,000 home, that’s an increase of $15,375 in value. In most states home solar is exempt from property taxes, making it a great way to boost value without paying taxes for it.

Bottom line

We’ve shared a lot of data on national averages and the potential cost of power going forward, but is solar for you? In the past, early adopters have been rewarded for going solar, and celebrate when they see $0 electric bills paid to the utility company.

Each home is different, each utility is different, and each homeowner has different needs, so evaluating whether solar is right for your home will take a little time and analysis. Representatives from solar companies will walk you through this analysis, and it’s generally a good rule of thumb to get at least three quotes for comparison.

A great resource for starting your research is the Solar Calculator developed by informational site SolarReviews. The calculator offers a quote and savings estimate based on local rates and incentives available to your area. The website also features reviews of installers, equipment, and more.

Some people will save tens of thousands of dollars in the long run with solar, while others may witness more modest savings. Solar will also provide the home clean, local energy, and U.S. solar generation is projected to reach 20% by 2050 as capacity expands, making an impact both on mitigating climate change and in supporting local jobs.

One indisputable benefit of solar is that it will offer greater clarity into what your electricity bills will cost over the next couple of decades, rather than leaving you exposed to whatever rates the utility company decides to charge in the future.


Related News

View more

More Electricity From Wind & Solar Than Nuclear For 1st Time In USA

U.S. Renewable Energy Share 2022 leads electricity generation trends, as wind and solar outpace nuclear and coal, per EIA data, with hydropower gains and grid growth highlighting rapid, sustainable capacity expansion nationwide.


Key Points

Renewables supplied over 25% of U.S. electricity in 2022, as wind and solar outpaced nuclear with double-digit growth.

✅ Renewables provided 25.52% of U.S. power Jan-Apr 2022.

✅ Wind and solar beat nuclear by 17.96% in April.

✅ Solar up 28.93%, wind up 24.25%; hydropower up 9.99%.


During the first four months of 2022, electrical generation by renewable energy sources accounted for over 25% of the nation’s electricity, projected to soon be about one-fourth as growth continues. In April alone, renewables hit a record April share of 29.3% — an all-time high.

And for the first time ever, the combination of just wind power and solar produce more electricity in April than the nation’s nuclear power plants — 17.96% more.

This is according to a SUN DAY Campaign analysis of data in EIA’s Electric Power Monthly report. The report also reveals that during the first third of this year, solar (including residential) generation climbed by 28.93%, while wind increased by 24.25%. Combined, solar and wind grew by 25.46% and accounted for more than one-sixth (16.67%) of U.S. electrical generation (wind: 12.24%, solar: 4.43%).

Hydropower also increased by 9.99% during the first four months of 2022. However, wind alone provided 70.89% more electricity than did hydropower. Together with contributions from geothermal and biomass, the mix of renewable energy sources expanded by 18.49%, and building on its second-most U.S. source in 2020 status helped underscore momentum as it provided about 25.5% of U.S. electricity during the first four months of 2022.

For the first third of the year, renewables surpassed coal and nuclear power by 26.13% and 37.80% respectively. In fact, electrical generation by coal declined by 3.94% compared to the same period in 2021 while nuclear dropped by 1.80%.

“Notwithstanding headwinds such as the COVID pandemic, grid access problems, and disruptions in global supply chains, solar and wind remain on a roll,” noted the SUN DAY Campaign’s executive director Ken Bossong. “Moreover, by surpassing nuclear power by ever greater margins, they illustrate the foolishness of trying to revive the soon-to-retire Diablo Canyon nuclear plant in California and the just-retired Palisades reactor in Michigan rather than focusing on accelerating renewables’ growth.”


Related News

View more

Low-emissions sources are set to cover almost all the growth in global electricity demand in the next three years

IEA Electricity Market Outlook 2023-2025 projects faster demand growth as renewables and nuclear dominate supply, stabilizing power-sector carbon emissions, with Asia leading expansion despite energy crisis shocks and weather-driven volatility.


Key Points

IEA forecast for 2023-2025 electricity demand: renewables and nuclear meet growth as power-sector emissions hold steady.

✅ Asia drives >70% of demand growth

✅ Renewables and nuclear meet most new supply

✅ CO2 intensity declines; grid flexibility vital


The world’s electricity demand growth slowed only slightly in 2022, despite headwinds from the energy crisis, and is expected to accelerate in the years ahead

Renewables are set to dominate the growth of the world’s electricity supply over the next three years as, renewables eclipse coal in global generation, together with nuclear power they meet the vast majority of the increase in global demand through to 2025, making significant rises in the power sector’s carbon emissions unlikely, according to a new IEA report.

After slowing slightly last year to 2% amid the turmoil of the global energy crisis and exceptional weather conditions in some regions, the growth in world electricity demand is expected to accelerate to an average of 3% over the next three years, the IEA’s Electricity Market Report 2023 finds. Emerging and developing economies in Asia are the driving forces behind this faster pace, which is a step up from average growth of 2.4% during the years before the pandemic and above pre-pandemic levels globally.

More than 70% of the increase in global electricity demand over the next three years is expected to come from China, India and Southeast Asia, as Asia’s power use nears half of the world by mid-decade, although considerable uncertainties remain over trends in China as its economy emerges from strict Covid restrictions. China’s share of global electricity consumption is currently forecast to rise to a new record of one-third by 2025, up from one-quarter in 2015. At the same time, advanced economies are seeking to expand electricity use to displace fossil fuels in sectors such as transport, heating and industry.

“The world’s growing demand for electricity is set to accelerate, adding more than double Japan’s current electricity consumption over the next three years,” said IEA Executive Director Fatih Birol. “The good news is that renewables and nuclear power are growing quickly enough to meet almost all this additional appetite, suggesting we are close to a tipping point for power sector emissions. Governments now need to enable low-emissions sources to grow even faster and drive down emissions so that the world can ensure secure electricity supplies while reaching climate goals.”

While natural gas-fired power generation in the European Union is forecast to fall in the coming years, as wind and solar outpaced gas in 2022, based on current trends, significant growth in the Middle East is set to partly offset this decrease. Sharp spikes in natural gas prices amid the energy crisis have in turn fuelled soaring electricity prices in some markets, particularly in Europe, prompting debate in policy circles over reforms to power market design.

Meanwhile, expected declines in coal-fired generation in Europe and the Americas are likely to be matched by a rise in the Asia-Pacific region, despite increases in nuclear power deployment and restarts of plants in some countries such as Japan. This means that after reaching an all-time high in 2022, carbon dioxide (CO2) emissions from global power generation are set to remain around the same level through 2025.

The strong growth of renewables means their share of the global power generation mix is forecast to rise from 29% in 2022 to 35% in 2025, with the shares of coal- and gas-fired generation falling. As a result, the CO2 intensity of global power generation will continue to decrease in the coming years. Europe bucked this global trend last year, however. The CO2 intensity of Europe’s power generation increased as a result of higher use of coal and gas amid steep drops in output from both hydropower, due to drought, and nuclear power, due to plant closures and maintenance. This setback will be temporary, though, as Europe’s power generation emissions are expected to decrease on average by about 10% a year through 2025.

Electricity demand trends varied widely by region in 2022. India’s electricity consumption rose strongly, while China’s growth was more subdued due to its zero-Covid policy weighing heavily on economic activity. The United States recorded a robust increase in demand, driven by economic activity and higher residential use amid hotter summer weather and a colder-than-normal winter, even as electricity sales projections continue to decline according to some outlooks.

Demand in the European Union contracted due to unusually mild winter weather and a decline in electricity consumption in the industrial sector, which significantly scaled back production because of high energy prices and supply disruptions caused by Russia’s invasion of Ukraine. The 3.5% decrease in EU demand was its second largest percentage decline since the global financial crisis in 2009, with the largest being the exceptional contraction due to the COVID-19 shock in 2020.

The new IEA report notes that electricity demand and supply worldwide are becoming increasingly weather dependent, with extreme conditions a recurring theme in 2022. In addition to the drought in Europe, there were heatwaves in India, resulting in the country’s highest ever peak in power demand. Similarly, central and eastern regions of China were hit by heatwaves and drought, which caused demand for air conditioning to surge amid reduced hydropower generation in Sichuan province. The United States also saw severe winter storms in December, triggering massive power outages.

These highlight the need for faster decarbonisation and accelerated deployment of clean energy technologies, the report says. At the same time, as the clean energy transition gathers pace, the impact of weather events on electricity demand will intensify due to the increased electrification of heating, while the share of weather-dependent renewables will continue to grow in the generation mix. In such a world, increasing the flexibility of power systems, which are under growing strain across grids and markets, while ensuring security of supply and resilience of networks will be crucial.


Related News

View more

Sign Up for Electricity Forum’s Newsletter

Stay informed with our FREE Newsletter — get the latest news, breakthrough technologies, and expert insights, delivered straight to your inbox.

Electricity Today T&D Magazine Subscribe for FREE

Stay informed with the latest T&D policies and technologies.
  • Timely insights from industry experts
  • Practical solutions T&D engineers
  • Free access to every issue

Live Online & In-person Group Training

Advantages To Instructor-Led Training – Instructor-Led Course, Customized Training, Multiple Locations, Economical, CEU Credits, Course Discounts.

Request For Quotation

Whether you would prefer Live Online or In-Person instruction, our electrical training courses can be tailored to meet your company's specific requirements and delivered to your employees in one location or at various locations.