
CSA Z462 Arc Flash Training – Electrical Safety Compliance Course
Our customized live online or in‑person group training can be delivered to your staff at your location.

- Live Online
- 6 hours Instructor-led
- Group Training Available
Regular Price:
$249
Coupon Price:
$199
PARIS
—
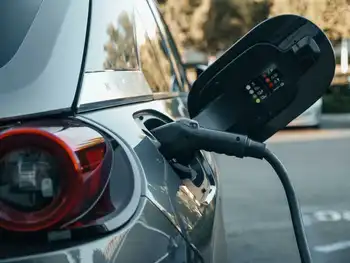
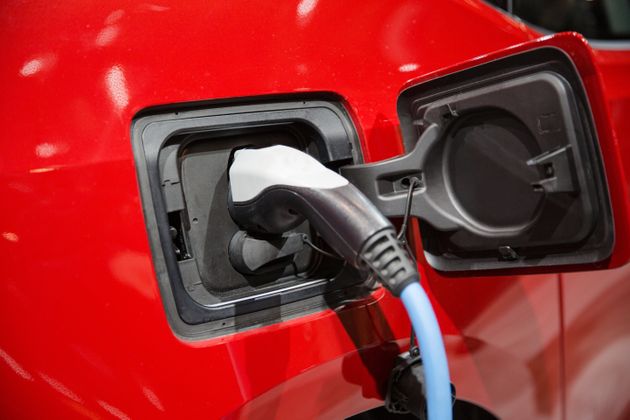
France Plug-In Electric Car Sales September 2023 show rapid EV adoption: 45,872 plug-ins, 30% market share, BEV 19.6%, PHEV 10.2%, with Tesla Model Y leading registrations amid sustained year-over-year growth.
What This Means
France registered 45,872 plug-ins in September 2023, a 30% share, with BEVs at 19.6% and PHEVs at 10.2%.
Tesla Model Y led BEVs with 5,035 registrations in September
YTD plug-in share 25%; BEV 15.9%, PHEV 9.1% across passenger cars
Total market up 9% YoY to 153,916; plug-ins up 35% YoY
New passenger car registrations in France increased in September by nine percent year-over-year to 153,916, mirroring global EV market growth trends, taking the year-to-date total to 1,286,247 (up 16 percent year-over-year).
The market has been expanding every month this year (recovering slightly from the 2020-2022 collapse and the period when EU EV share grew during lockdowns across the bloc) and also is becoming more and more electrifying thanks to increasing plug-in electric car sales.
According to L’Avere-France, last month 45,872 new passenger plug-in electric cars were registered in France (35 percent more than a year ago), which represented almost 30 percent of the market, aligning with the view that the age of electric cars is arriving ahead of schedule. That's a new record share for rechargeable cars and a noticeable jump compared to just over 24 percent a year ago.
What's even more impressive is that passenger all-electric car registrations increased to over 30,000 (up 34 percent year-over-year), taking a record share of 19.6 percent of the market. That's basically one in five new cars sold, and in the U.S., plug-ins logged 19 billion electric miles in 2021 as a benchmark.
Plug-in hybrids are also growing (up 35% year-over-year), and with 15,699 units sold, accounted for 10.2 percent of the market (a near record value).
Plug-in car sales in France – September 2023
So far this year, more than 341,000 new plug-in electric vehicles have been registered in France, including over 321,000 passenger plug-in cars (25 percent of the market), while in the U.S., EV sales are soaring into 2024 as well.
Plug-in car registrations year-to-date (YOY change):
- Passenger BEVs: 204,616 (up 45%) and 15.9% market share
- Passenger PHEVs: 116,446 (up 31%) and 9.1% market share
- Total passenger plug-ins: 321,062 (up 40%) and 25% market share
- Light commercial BEVs: 20,292 (up 111%)
- Light commercial PHEVs: 281 (down 38%)
- Total plug-ins: 341,635 (up 43%)
For reference, in 2022, more than 346,000 new plug-in electric vehicles were registered in France (including almost 330,000 passenger cars, which was 21.5 percent of the market).
We can already tell that the year 2023 will be very positive for electrification in France, with a potential to reach 450,000 units or so, though new EV incentive rules could reshape the competitive landscape.
Models
In terms of individual models, the Tesla Model Y again was the most registered BEV with 5,035 new registrations in September. This spectacular result enabled the Model Y to become the fifth best-selling model in the country last month (Tesla, as a brand, was seventh).
The other best-selling models are usually small city cars - Peugeot e-208 (3,924), Dacia Spring (2,514), Fiat 500 electric (2,296), and MG4 (1,945), amid measures discouraging Chinese EVs in France. Meanwhile, the best-selling electric Renault - the Megane-e - was outside the top five BEVs, which reveals to us how much has changed since the Renault Zoe times.
After the first nine months of the year, the top three BEVs are the Tesla Model Y (27,458), Dacia Spring (21,103), and Peugeot e-208 (19,074), slightly ahead of the Fiat 500 electric (17,441).
Related News
Related News

UK electric car inquiries soar during fuel supply crisis
UK Petrol Shortages Drive EV Adoption as fuel crisis spurs electric vehicles, plug-in car demand,…
View more
Electric vehicles can now power your home for three days
Vehicle-to-Home (V2H) Power enables EVs to act as backup generators and home batteries, using bidirectional…
View more

Major investments by Canada and Quebec in electric vehicle battery assembly
Lion Electric Battery Plant Quebec secures near $100M public investment for an automated battery-pack assembly…
View more
Netherlands' Renewables Drive Putting Pressure On Grid
The Netherlands grid crisis exposes how rapid renewable energy growth is straining transmission capacity. Solar,…
View more
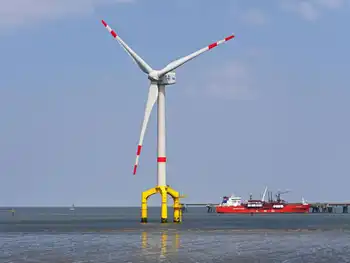
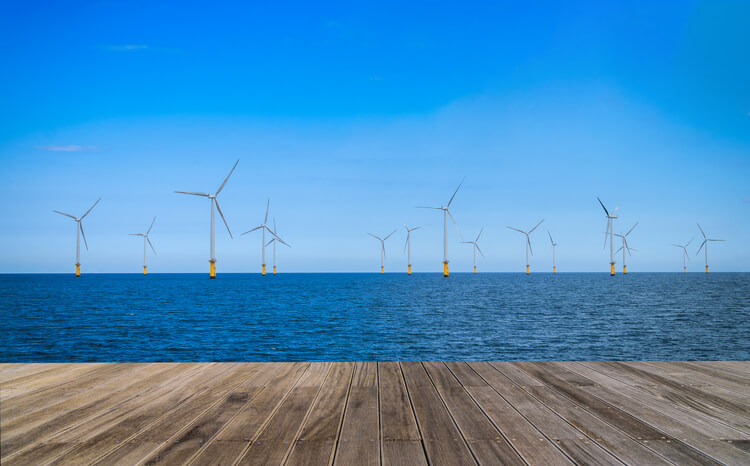
4 European nations to build North Sea wind farms
North Sea Offshore Wind Farms will deliver 150 GW by 2050 as EU partners scale…
View more
US Electric Vehicle Momentum Slows as Globe Surges
US electric vehicle momentum is slowing as tax credits expire, tariffs increase costs, and interest…
View more
Sign Up for Electricity Forum’s Newsletter
Stay informed with our FREE Newsletter — get the latest news, breakthrough technologies, and expert insights, delivered straight to your inbox.
Electricity Today T&D Magazine Subscribe for FREE

Stay informed with the latest T&D policies and technologies.
- Timely insights from industry experts
- Practical solutions T&D engineers
- Free access to every issue

