CSA Z463 Electrical Maintenance -
Our customized live online or in‑person group training can be delivered to your staff at your location.

- Live Online
- 6 hours Instructor-led
- Group Training Available
Regular Price:
$249
Coupon Price:
$199
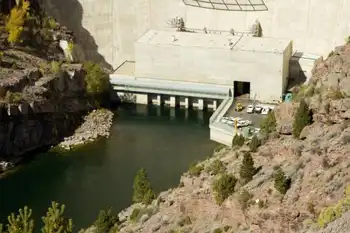
Your bottom-scraping boats didn't lie, Mountain Island Lake residents: The water really has been lower than official numbers say.
Duke Energy said the gauge by which it tracks lake levels apparently went on the blink about three weeks ago. It was recalibrated and will be replaced. Residents of Gar Creek Cove, on the lake's Mecklenburg side, knew something was wrong. Boats that in past years glided in and out of the cove at an elevation of 96 feet - Duke's target for this time of year - were mired in mud lately.
"Seems to me that two feet of water is 'missing,'" a resident wrote to the Observer. Duke at first said visual inspections found nothing awry. Further investigation found the broken gauge Monday, spokeswoman Marilyn Lineberger said.
Duke said it doesn't know how far off the gauge was. Lineberger said the lake is believed to have fallen somewhere below the target, but higher than the minimum level - a difference of 1.7 feet. The mechanical gauge, mounted at the lake's dam, apparently went wrong when Duke drew down Mountain Island on April 21 for several days of work at the Riverbend power plant on the western shore. Duke's Web site, apparently in error, shows levels consistently above the target since April 25, as Duke refilled the lake.
Charlotte-Mecklenburg Utilities reported no problems drawing water from the lake, its chief water source.
There's no indication that gauges at other lakes are broken, Lineberger said.
Related News
Can Europe's atomic reactors bridge the gap to an emissions-free future?
EU Nuclear Reactor Life Extension focuses on energy security, carbon-free electricity, and safety as ageing…
View more

Egypt's renewable energy to reach 6.6 GW by year-end
Egypt Renewable Energy Expansion targets solar and wind power projects to diversify the energy mix,…
View more
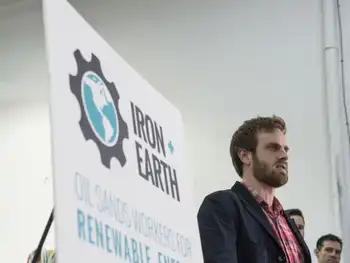
Opinion: Fossil-fuel workers ready to support energy transition
Canada Net-Zero Transition unites energy workers, R&D, and clean tech to decarbonize steel and cement…
View more
Invest in Hydropower to Tackle Coronavirus and Climate Crisis Impacts
Hydropower Covid-19 Resilience highlights clean, reliable energy and flexible grid services, with pumped storage, automation,…
View more
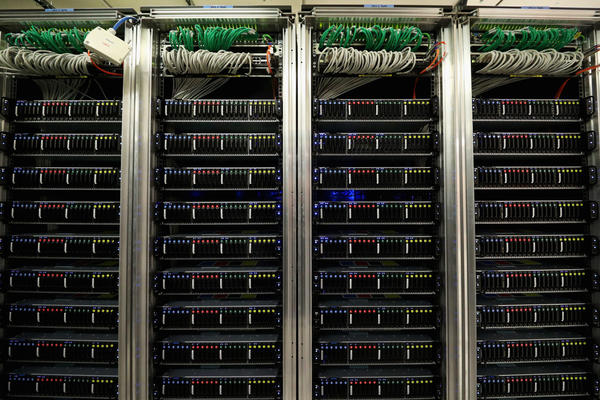
Data Centers May Increase Canadian Electricity Bills
Analysts warn that rising data-center and AI demand threatens to push energy infrastructure costs onto…
View more
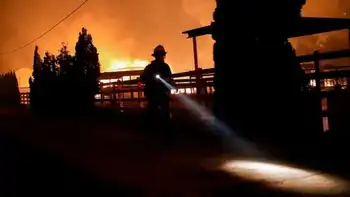
California faces huge power cuts as wildfires rage
California Wildfire Power Shut-Offs escalate as PG&E imposes blackouts amid high winds, Getty and Kincade…
View more
Sign Up for Electricity Forum’s Newsletter
Stay informed with our FREE Newsletter — get the latest news, breakthrough technologies, and expert insights, delivered straight to your inbox.
Electricity Today T&D Magazine Subscribe for FREE

Stay informed with the latest T&D policies and technologies.
- Timely insights from industry experts
- Practical solutions T&D engineers
- Free access to every issue

