Electrical Commissioning In Industrial Power Systems
Our customized live online or in‑person group training can be delivered to your staff at your location.

- Live Online
- 12 hours Instructor-led
- Group Training Available
Regular Price:
$599
Coupon Price:
$499
LOS ANGELES
—
California Renewable Energy Record highlights near-100% clean power as CAISO reports solar, wind, and storage meeting demand, with Interstate 10 arrays and distributed rooftop photovoltaics boosting the grid during Stagecoach, signaling progress toward 100%.
Breaking Down the Details
CA Renewable Energy Record marks CAISO's peak when renewables nearly met total load, led by utility solar and storage.
Renewables hit 99.87% of load at 2:50 pm, per CAISO verification.
Solar provided about two-thirds of total generation at peak.
Curtailments and reserves adjusted the initial 100% reading.
Commerce tariff probe on imported panels delays solar-storage builds.
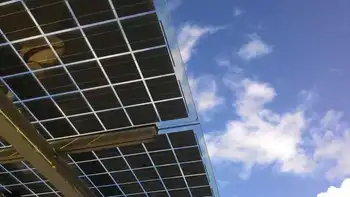
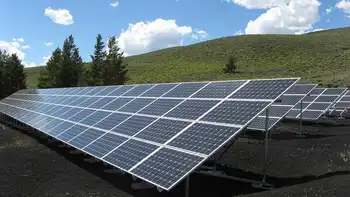
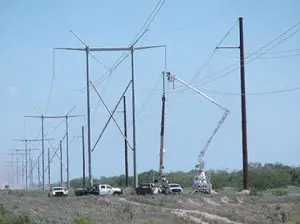
Renewable electricity met just shy of 100% of California's demand for the first time on Saturday, officials said, much of it from large amounts of solar power, part of a California solar boom, produced along Interstate 10, an hour east of the Coachella Valley.
While partygoers celebrated in the blazing sunshine at the Stagecoach music festival, "at 2:50 (p.m.), we reached 99.87 % of load served by all renewables, which broke the previous record," said Anna Gonzales, spokeswoman for California Independent System Operator, a nonprofit that oversees the state's bulk electric power system and transmission lines. Solar power provided two-thirds of the amount needed.
Environmentalists who've pushed for years for all of California's power to come from renewables and meet clean energy targets were jubilant as they watched the tracker edge to 100% and slightly beyond.
"California busts past 100% on this historic day for clean energy!" Dan Jacobson, senior adviser to Environment California, tweeted.
"Once it hit 100%, we were very excited," said Laura Deehan, executive director for Environment California. She said the organization and others have worked for 20 years to push the Golden State to complete renewable power via a series of ever tougher mandates, even as solar and wind curtailments increase across the grid. "California solar plants play a really big role."
But Gonzales said CAISO double-checked the data Monday and had to adjust it slightly because of reserves and other resource needs, an example of rising curtailments in the state.
Environment California pushed for 1 million solar rooftops statewide, which has been achieved, adding what some say is a more environmentally friendly form of solar power, though wildfire smoke can undermine gains, than the solar farms, which eat up large swaths of the Mojave desert and fragile landscapes.
Want more climate news? Sign up for Climate Point once a week in your inbox
What's everyone talking about? Sign up for our trending newsletter to get the latest news of the day
'Need to act with that same boldness':A record 10% of the world's power was generated by wind, solar methods in 2021
Deehan said in a statement that more needs to be done, especially at the federal level. "Despite incredible progress illustrated by the milestone this weekend, and the fact that U.S. renewable electricity surpassed coal in 2022, a baffling regulatory misstep by the Biden administration has advocates concerned about backsliding on California’s clean energy targets."
Deehan said a Department of Commerce inquiry into tariffs on imported solar panels is delaying thousands of megawatts of solar-storage projects in California, even as U.S. renewable energy hit a record 28% in April across the grid.
Still, Deehan said, “California has shown that, for one brief and shining moment, we could do it! It's time to move to 100% clean energy, 100% of the time.”
Related News
Related News

Rooftop Solar Grids
Rooftop solar grids transform urban infrastructure with distributed generation, photovoltaic panels, smart grid integration and…
View more
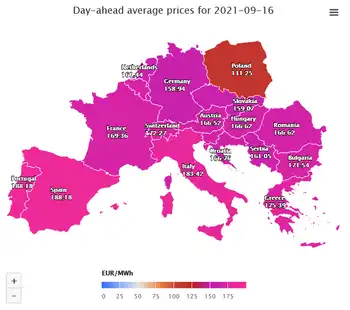
Energy crisis is a 'wake up call' for Europe to ditch fossil fuels
EU Clean Energy Transition underscores the shift from fossil fuels to renewable energy, decarbonization, and…
View more
In 2021, 40% Of The Electricity Produced In The United States Was Derived From Non-Fossil Fuel Sources
Renewable Electricity Generation is accelerating the shift from fossil fuels, as wind, solar, and hydro…
View more
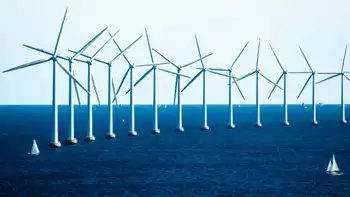
Wind Denmark - Danish electricity generation sets a new green record
Denmark 2019 electricity CO2 intensity shows record-low emissions as renewable energy surges, wind power dominates,…
View more
US Grid Gets an Overhaul for Renewables
FERC Transmission Planning Overhaul streamlines interregional grid buildouts, enabling high-voltage lines, renewable integration, and grid…
View more
Garbage Truck Crash Knocks Down Power Poles in Little Haiti
Little Haiti Garbage Truck Power Outage in Miami after mechanical arms snagged power lines, snapping…
View more
Sign Up for Electricity Forum’s Newsletter
Stay informed with our FREE Newsletter — get the latest news, breakthrough technologies, and expert insights, delivered straight to your inbox.
Electricity Today T&D Magazine Subscribe for FREE

Stay informed with the latest T&D policies and technologies.
- Timely insights from industry experts
- Practical solutions T&D engineers
- Free access to every issue
