NFPA 70E Training
Our customized live online or in‑person group training can be delivered to your staff at your location.

- Live Online
- 6 hours Instructor-led
- Group Training Available
Regular Price:
$199
Coupon Price:
$149
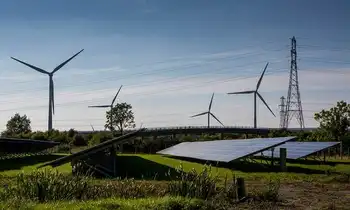
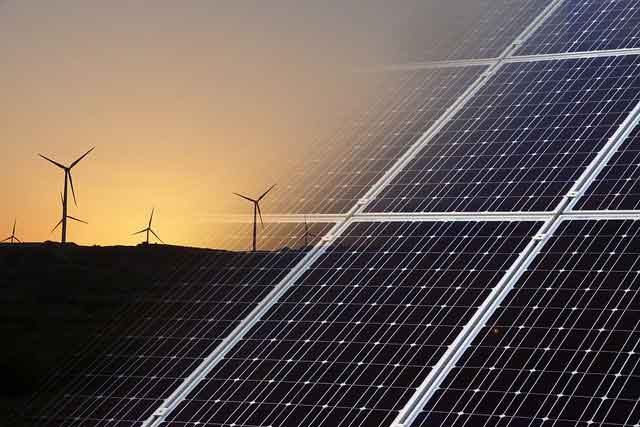
Egypt wind energy expansion draws 72 bidders as BOO projects and EETC PPAs scale capacity along the Red Sea and Gulf of Suez, alongside Zafarana wind and Koraymat solar, advancing Egypt's 20% renewables target.
Understanding the Story
A national push to build BOO wind projects under EETC PPAs, scaling capacity to meet Egypt's renewable targets.
- 72 companies bought bid documents in June
- BOO model with 20-25 year term; EETC as offtaker
- 20% renewables by 2020; 12% from wind
- 430 MW wind; 920 MW financing; Zafarana 545 MW by 2010
- Land: 300k acres Gulf of Suez; 1.6M acres Upper Egypt
In response to a tender issued by Egypt in May for development of a 250-megawatt (MW) wind farm on the country's east coast on a build-own-operate basis, 32 international companies have presented their bids.
Hassan Younes, the country's electricity minister, said that 72 companies purchased the bidding documents in June. He said that the numbers signify the interest generated by the country's wind energy sector in the international power industry, as Egypt strengthens its power sector through new projects. The selected project developer will design, finance, build, own and operate the plant for a period of 20 to 25 years. During that period, power generated will be purchased by state-run Egyptian Electricity Transmission Company (EETC). The names of the companies in the fray have not been disclosed so far.
In April 2007, Egypt's Supreme Council adopted an ambitious plan under which the country will generate 20% of its electricity from renewable sources by 2020, and 12% of that would be accounted for by wind energy. The plan was especially ambitious since renewable energy accounted for a mere 0.5% of the country's power generation in 2007.
Today, Egypt procures 10% of generated power from renewable sources. Egypt is an oil and gas producer, but according to Egyptian officials, the country's oil and gas reserves are expected to last for just another 30 years or so, driving the need for renewable energy and investment of $2.84 billion in the power sector overall.
Egypt currently produces 430 MW of wind power, and finances for generating an additional 920 MW are being finalized, with Egypt selecting GE technology for key contracts to support expansion. The country has been developing its wind power industry along the Red Sea coast. In June, the nation's Electricity Ministry said that it was allocating more than 300,000 acres of land near the Gulf of Suez on the Red Sea coast for wind farm projects.
In August, the ministry announced plans to allocate a further 1.6 million acres of land for wind farms in Upper Egypt. By 2010, the Zafarana wind farm will generate 545 MW of power and thereby become the largest wind farm in the Middle East and all of Africa.
Plans are either finalized or under discussion to set up several windfarms with a combined capacity of about 840 MW in the Gulf of El- Zayt.
Late last month, Younes announced that Egypt's first solar power project, which is being set up near Cairo at Koraymat, will be completely operational from 2010. The 140-MW solar power project is part of a larger 2,900-MW facility that includes three non-solar power units. The facility is already connected to the national grid, which is accessible to almost 99% of the country's population.
In October 2007, Egypt had announced that it would build three to four nuclear power plants to meet the country's growing energy needs. The first plant was to be operational within a decade, and the government had said that it had received nuclear cooperation offers from China, France, Kazakhstan and Russia.
Egypt had suspended earlier nuclear energy reactor plans after the Chernobyl disaster of 1996, but later sought nuclear engineer training to rebuild capacity.
Although revived in 2006 and 2007, the nuclear program has not made much headway with numerous conflicts over site selection that delayed progress, service-contract negotiations, and funding issues.
Egypt's current power generation capacity is 25,000 MW, and according to Younes, the country intends to add 58,000 MW to its capacity by 2027. The country will invest about $100 billion to $120 billion to achieve the defined target. The generation capacity is expected to reach 32,000 MW by 2013 as the nation struggles to meet a growing demand for power, backed by an investment of $22.2 billion in the power sector in later initiatives.
About 11 thermal power plants are expected to be constructed by 2013.
The government also has conducted two feasibility studies with neighboring nations Ethiopia and Sudan regarding possible hydroelectric projects.
Related News
Related News
Why subsidies for electric cars are a bad idea for Canada
EV Subsidies in Canada influence greenhouse-gas emissions based on electricity grid mix; in Ontario and…
View more
EU draft shows plan for more fixed-price electricity contracts
EU Electricity Market Reform advances two-way CfDs, PPAs, and fixed-price tariffs to cut volatility, support…
View more
Nuclear helps Belgium increase electricity exports in 2019
Belgium Energy Mix 2019 shows strong nuclear output, rising offshore wind, net electricity exports, and…
View more
Wind and solar make more electricity than nuclear for first time in UK
UK Renewables Surpass Nuclear Milestone as wind farms and solar panels outpace atomic output, cutting…
View more
Lebanon Cabinet approves watershed electricity sector reform
Lebanon Electricity Sector Reform aims to overhaul tariffs, modernize the grid, cut fuel oil subsidies,…
View more
Chester County Landfill Converts Methane to Renewable Gas
SECCRA Waga Energy RNG Partnership captures landfill methane with WAGABOX, upgrades biogas to pipeline-quality RNG,…
View more
Sign Up for Electricity Forum’s Newsletter
Stay informed with our FREE Newsletter — get the latest news, breakthrough technologies, and expert insights, delivered straight to your inbox.
Electricity Today T&D Magazine Subscribe for FREE

Stay informed with the latest T&D policies and technologies.
- Timely insights from industry experts
- Practical solutions T&D engineers
- Free access to every issue
