NFPA 70E Training
Our customized live online or in‑person group training can be delivered to your staff at your location.

- Live Online
- 6 hours Instructor-led
- Group Training Available
Regular Price:
$199
Coupon Price:
$149
EU ETS 2011 Emissions undershot the cap by 114 Mt, as verified data showed weaker industrial output, power and heat declines, stronger wind and solar generation, and an oversupplied cap-and-trade carbon market pressuring prices.
Breaking Down the Details
Verified 2011 EU ETS emissions were 114 Mt below cap, reflecting weak output, stronger renewables, and oversupply.
- Emissions 114 Mt below 2011 cap, oversupply persists.
- Power and heat down 41 Mt to 1,141 Mt.
- Mild winter and wind/solar reduced output.
- Industrial emissions fell 12 Mt to 746 Mt.
Last year, some 1,888 million tonnes Mt of greenhouse gases were emitted by the 27 countries that participate in the European Union’s Emissions Trading Scheme EU ETS, plus Norway. This decrease in emissions, equivalent to 2.6 percent on the comparable 2010 figure of 1,939 Mt, reflects a deteriorating economic outlook towards the end of 2011 and mild weather, according to Thomson Reuters Point Carbon, the leading provider of market intelligence, news, analysis, forecasting and advisory services for the energy and environmental markets.
Moreover, emissions last year came in 114 million tons below the 2011 EU Emissions Trading System (EU ETS) cap, meaning the scheme was oversupplied for the third year in a row and the sixth time in seven years, leading some carbon traders to explore other commodities, and indicating that recovery has still not returned European economies to their pre-crash levels.
The analysis is based on the verified emissions data published today by the European Commission via its Community Independent Transaction Log (CITL) for 9,977 installations accounting for 90 percent of 2010 greenhouse gas emissions across the EU.
According to Thomson Reuters Point Carbon, the data in 2011 saw the tide turn in terms of the emissions generated by the economies of Europe, with global CO2 emissions offering a contrasting benchmark, as early positive developments slowed and turned to declining output and a related decline in emissions towards the end of the year.
The largest relative changes were seen in the power and heat sector. This sector saw emissions decreasing by 41 million tons to 1,141 million tons as “a mild winter and increased renewable generation, especially from wind and solar power, outweighed the impact on emissions from the shutdown of nuclear power plants in Germany”, said Yan Qin, Senior Modeling Analyst for Thomson Reuters Point Carbon.
Qin added that there is still some uncertainty surrounding the heat sector as France has submitted only 25 percent of its emissions so far. France has a very large proportion of electric heating facilities so its emissions are affected considerably by weather patterns.
In the industrial sectors, emissions were down to 746 million tons, a decrease of 12 million tons year-on-year, “due to declining production levels towards the end of the year and assumed modest intensity improvements, amid an economic slump hampering clean energy progress”, explained Bjøn Inge Vik, Senior Carbon Analyst for Thomson Reuters Point Carbon.
According to Marcus Ferdinand, Senior Market Analyst, Thomson Reuters Point Carbon, “the outcome of the 2011 emissions data is below market expectations and will have an additional bearish impact on the current low carbon prices in Europe. However, the lower than expected verified emission numbers could increase support for the set-aside of allowances in phase three of the EU Emissions Trading System (EU ETS)”.
Ferdinand adds that “we started the 2011 with expectations for steady growth and recovery for most sectors after the financial crisis and, indeed, the first half of the year looked promising with positive economic indicators and industrial production levels growing.
However, concerns over Greek and southern European debt escalated during the latter half of the year and worries over slowing growth in the Euro zone and the possibility of another recession materialized in slowing production levels for important industry sectors, reflected in the drop in emissions”.
Related News
Related News
More young Canadians would work in electricity… if they knew about it
Generation Impact Report reveals how Canada's electricity sector can recruit Millennials and Gen Z, highlighting…
View more
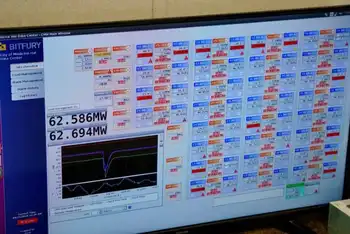
Bitcoin mining uses so much electricity that 1 city could curtail facility's power during heat waves
Medicine Hat Bitcoin Mining Facility drives massive electricity demand and energy use, leveraging natural gas…
View more
Schneider Electric Aids in Notre Dame Restoration
Schneider Electric Notre Dame Restoration delivers energy management, automation, and modern electrical infrastructure, boosting safety,…
View more

Ontario Energy minister downplays dispute between auditor, electricity regulator
Ontario IESO Accounting Dispute highlights tensions over public sector accounting standards, auditor general oversight, electricity…
View more

Cal ISO Warns Rolling Blackouts Possible, Calls For Conservation As Power Grid Strains
Cal ISO Flex Alert urges Southern California energy conservation as a Stage 2 emergency strains…
View more
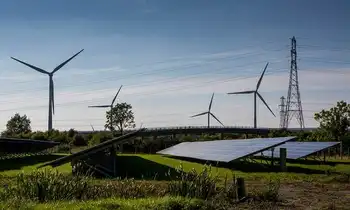
Wind and solar make more electricity than nuclear for first time in UK
UK Renewables Surpass Nuclear Milestone as wind farms and solar panels outpace atomic output, cutting…
View more
Sign Up for Electricity Forum’s Newsletter
Stay informed with our FREE Newsletter — get the latest news, breakthrough technologies, and expert insights, delivered straight to your inbox.
Electricity Today T&D Magazine Subscribe for FREE

Stay informed with the latest T&D policies and technologies.
- Timely insights from industry experts
- Practical solutions T&D engineers
- Free access to every issue

