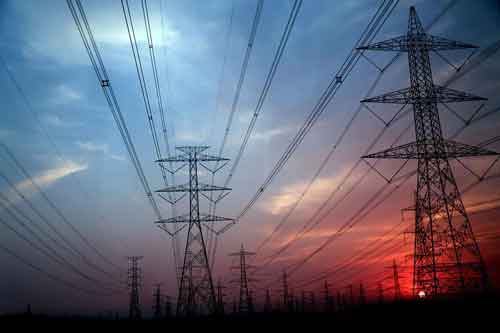
Trends in Electricity Prices in Europe: Expect More Volatility


Trends in Electricity Prices

NFPA 70b Training - Electrical Maintenance

Our customized live online or in‑person group training can be delivered to your staff at your location.

  • Live Online
  • 12 hours Instructor-led
  • Group Training Available
Regular Price:
$599
Coupon Price:
$499
Reserve Your Seat Today

EU Energy Outlook 2050 projects volatile electricity prices as wind, solar PV, and hydropower dominate capacity; natural gas supports dispatchable supply, CO2 prices rise, and e-mobility, storage, and national policy reforms reshape EU power markets.


Key Points

A modeled scenario of EU-28 power markets to 2050, analyzing capacity, prices, and policy impacts across technologies.

✅ Wind and solar dominate capacity; gas remains key dispatchable.

✅ CO2 costs and fuel trends drive price volatility and extremes.

✅ Storage, e-mobility, and policy reforms reshape national markets.


European electricity markets are constantly changing. Revisions of regulations and new laws, e.g. the Electricity Market Act in Germany, affect business decisions and market trends, reflecting Europe's push for electrification across sectors. In our EU Energy Outlook 2050 we provide non-weighted average values of a potential scenario for EU-28 countries (including Norway and Switzerland), based on the fundamental power market model developed by Energy Brainpool.

Power2Sim is a software tool that simulates the hourly electricity prices until the year 2050 for all countries of the European Union along with Norway and Switzerland. Most assumptions for the scenario are based on the IEA. The assumptions are adapted by Energy Brainpool according to national targets for Germany or for France. Results for individual countries vary strongly in some cases. For sound market assessments, solid modeling of individual national markets, including sensitivity analyses, is indispensable.
Supply side: Installed generating capacities in EU-28


Figure 1: Gross generation capacities in GW, source: Energy Brainpool

Generation capacity will be dominated by fluctuating renewable energies, in particular wind, solar PV and hydropower, as can be seen in figure 1. Wind energy is expected to expand to an estimated 30 per cent of overall generation capacity by 2050. With regard to dispatchable fossil fuel capacities, primarily natural gas power plants are planned to be built in Europe. The capacity of coal-fired power plants will fall to 4 per cent of total capacity by 2050. All in all, conventional dispatchable generation capacity will decline from 50 per cent to 30 per cent. Fluctuating capacity will dominate, which in turn will lead to more volatile prices.

  1. Demand side: coverage of the demand by energy sources in EU-28


Figure 2: Gross electricity production of generation technologies in TWh, source: Energy Brainpool

Electricity generation is expected to increase by 18 per cent till 2050 as a result of higher demand caused by increased electrification of the heat and transport sectors, as more drivers go electric across markets. While the production from coal-fired power plants will decline substantially, the production from natural gas fired power plants will double. In 2050, variable renewable energies will generate some 36 per cent of electricity while over 44 per cent will be produced by dispatchable conventional power plants. Remaining electricity production will come from renewable energy technologies such as biomass power plants.

  1. Commodity price development


Figure 3: Commodity prices (real EUR2015), source: Energy Brainpool

Commodity prices up to 2020 are based on the prices on the futures markets. The expected price trend of commodities between 2020 to 2050 in our model follows the 450ppm (2° C) scenario of the IEA’s “World Energy Outlook 2016”. The 2° C scenario is primarily achieved by a sharp increase of EUA prices (i.e. CO2 prices in the EU Emission Trading System). As high CO2 prices will lead to lower demand for fossil fuels in the power sector, prices of natural gas and hard coal will remain at a relatively constant level.

  1. Simulated annual power prices EU 28


Figure 4: Power prices (real EUR2015) and deviation range in national EU-28 markets, source: Energy Brainpool

Power prices until 2020 are influenced strongly by low prices for commodities on the futures markets. The development of electricity prices from 2020 to 2030 is influenced by increasing gas prices (due to higher demand, as more carbon-intensive generation is being shut-down) and CO₂-certificate prices, with U.S. DOE EV demand analysis illustrating how transport electrification can add load. From 2040 onwards electricity prices are expected to remain on a relative constant level despite rising prices for CO₂. The reason is that the high contribution of wind and solar power will increase the periods of low and even negative electricity prices. As we indicated above, these are average prices – they may vary considerably in individual countries.

  1. Average sales values and sales volumes for wind in EU-28


Figure 5: Sales values (real EUR2015) and volumes wind EU-28, source: Energy Brainpool

The sales value of wind energy will rise till 2040 and thereafter remain at a high level despite increasing installed capacities and simultaneous cannibalisation effects. Sales volumes (share of annual generation at positive spot market prices) will decrease only slightly. The few hours with extreme electricity prices benefit wind power plants which generate positive revenues in these hours.

Sales value is the average weighted price a technology (solar or wind) can achieve in the spot market in all hours during which the price is higher than or equal to 0 EUR/MWh. Sales value represents a more realistic picture of the revenue of renewable energy sources compared to other indices, because it discounts periods in which prices are zero or negative and the sources may be switched off.

  1. Average sales values and sales volumes for solar in EU-28


Figure 6: Sales value (real EUR2015) and volumes solar in EU-28, source: Energy Brainpool

The sales value of solar energy will rise till 2040 and remain at a high level thereafter, although still below the level of wind energy. This is because of the strong simultaneousness effect of solar power. This results in strong price declines at times of high solar feed-in. The sales volumes on EU average will only decrease slightly. However, in some countries the decline is much steeper.

  1. Extreme prices EU-28


Figure 7: Number of extreme prices, source: Energy Brainpool

Due to the high share of fluctuating generation capacities, electricity prices will become more volatile. Moreover, extremely high and extremely low prices will occur. Extreme prices are electricity prices equal to/below 0 EUR/MWh and those above 100 EUR/MWh. The anticipated ratio between the two extremes will create new opportunities for market newcomers and new technologies, e.g. storage systems. Extreme prices can be anticipated in Europe from 2026 on.

  1. E-mobility in the EU-28


Figure 8: Demand of e-mobility in EU-28, source: Energy Brainpool

The future development of e-mobility is a decisive factor for the European and national targets in terms of greenhouse gas emission reductions. If the decarbonisation of the transport sector will genuinely be implemented through e-mobility technologies, electricity demand from EVs will drastically increase. A share of 100 per cent e-mobility in the private transport sector in the EU28 by 2050 will result in an additional electricity demand of around 830 TWh/a, around a quarter of current total European electricity demand.

The development of e-mobility was not taken into account in the results presented above. If it were taken into account however, the increased demand from e-mobility would lead to higher electricity prices. This in turn would incentivise further investments in new generating capacities to cover for surplus demand. If climate goals are to be achieved, e-mobility needs to be powered by carbon free generating technologies. This would lead to a different technology mix than seen in Figure 1.


Related News

Related News

Dewa in China to woo renewable energy firms

Dewa-China Renewable Energy Partnership advances solar, clean energy, smart grid, 5G, cloud, and Big Data, linking Dewa with Hanergy and Huawei for R&D, smart meters, demand management, and resilient network infrastructure.


Key Points

A Dewa collaboration with Hanergy and Huawei to co-develop solar, smart grid, 5G, cloud, and resilient utility networks.

✅ MoU expands solar PV and distributed generation in Dubai and China

✅ Smart grid R&D: smart meters, demand response, self-healing networks

✅ 5G, cloud, and Big Data enable secure, scalable smart city services


A high-level delegation from Dubai Electricity and Water Authority (Dewa) recently visited China in bid to build closer ties with Chinese renewable and clean energy and smart services and smart grid companies, amid broader power grid modernization in Asia trends.

The team led by the managing director and CEO Saeed Mohammed Al Tayer visited the headquarters of Hanergy Holding Group, one of the largest international companies in alternative and renewable energy, in Beijing.

The visit complements the co-operation between Dewa and Hanergy after the signing MoU between the two sides last May, said a statement from Dewa.

The two parties focused on renewable and clean energy and its development, including efforts to integrate solar into the grid through advanced programs, and enhancing opportunities for joint investment.

Al Tayer also visited the Exhibition Hall and Exhibition Centre of the Hanergy Clean Energy Exhibition spread over a 7,000-sq-m area at the Beijing Olympic Park.

He discussed solar power technologies and applications, which included integrated photovoltaic panels and their distribution on the roofs of industrial and residential buildings, residential and mobile power systems, micro-grid installations in remote regions, solar-powered vehicles, and various elements of the exhibition.

Al Tayer and the accompanying delegation later visited the Beijing R&D Centre, which is one of Huaweis largest research institutes, known for Huawei smart grid initiatives across global markets, that employs over 12,000 people. The centre covers the latest pre-5G solutions, Cloud, Big Data, as well as vertical solutions for a smart and safe city.

"The visit is part of a joint venture with Huawei, which includes R&D projects to develop smart network infrastructures and various mechanisms and technologies, aligned with recent U.S. grid improvement funding initiatives, such as smart meters for electricity and water services, energy demand management, and self-recovery mechanisms from errors and disasters," he added.


Related News

View more

Electricity sales in the U.S. actually dropped over the past 7 years

US Electricity Sales Decline amid population growth and GDP gains, as DOE links reduced per capita consumption to energy efficiency, warmer winters, appliances, and bulbs, while hotter summers and rising AC demand may offset savings.


Key Points

US electricity sales fell 3% since 2010 despite population and GDP growth, driven by efficiency gains and warmer winters.

✅ DOE links drops to efficiency and warmer winters

✅ Per capita residential use fell about 7% since 2010

✅ Rising AC demand may offset winter heating savings


Since 2010, the United States has grown by 17 million people, and the gross domestic product (GDP) has increased by $3.6 trillion. Yet in that same time span, electricity sales in the United States actually declined by 3%, according to data released by the U.S. Department of Energy (DOE), even as electricity prices rose at a 41-year pace nationwide.

The U.S. decline in electricity sales is remarkable given that the U.S. population increased by 5.8% in that same time span. This means that per capita electricity use fell even more than that; indeed, the Department of Energy pegs residential electricity sales per capita as having declined by 7%, even as inflation-adjusted residential bills rose 5% in 2022 nationwide.

There are likely multiple reasons for this decline in electricity sales. Department of Energy analysts suggest that, at least in part, it is due to increased adoption of energy-efficient appliances and bulbs, like compact fluorescents. Indeed, the DOE notes that there is a correlation between consumer spending on “energy efficiency” and a reduction in per capita electricity sales, while utilities invest more in delivery infrastructure to modernize the grid.

Yet the DOE also notes that states with a greater increase in warm weather days had a corresponding decrease in electricity sales, as milder weather can reduce power demand across years. In southern states, the effect was most dramatic: for instance, from 2010 to 2016, Florida had a 56% decrease in cold weather days that would require heating and as a result, saw a 9% decrease in per capita electricity sales.

The moral is that warm winters save on electricity. But if global temperatures continue to rise, and summers become hotter, too, this decrease in winter heating spending may be offset by the increased need to run air conditioning in the summer, and given how electricity and natural gas prices interact, overall energy costs could shift. Indeed, it takes far more energy to cool a room than it does to heat it, for reasons related to the basic laws of thermodynamics. 


Related News

View more

PG&E Supports Local Communities as It Pays More Than $230 Million in Property Taxes to 50 California Counties

PG&E property tax payments bolster counties, education, public safety, and infrastructure across Northern and Central California, reflecting semi-annual levies tied to utility assets, capital investments, and economic development that serve 16 million customers.


Key Points

PG&E property tax payments are semi-annual county taxes funding public services and linked to utility infrastructure.

✅ $230M paid for Jul-Dec 2017 across 50 California counties

✅ Estimated $461M for FY 2017-2018, up 12% year over year

✅ Investments: $5.9B in grid, Gas Safety Academy, control center


Pacific Gas and Electric Company (PG&E) paid property taxes of more than $230 million this fall to the 50 counties where the energy company owns property and operates gas and electric infrastructure that serves 16 million Californians. The tax payments help support essential public services like education and public health and safety actions across the region.

The semi-annual property tax payments made today cover the period from July 1 to December 31, 2017.

Total payments for the full tax year of July 1, 2017 to June 30, 2018 are estimated to total more than $461 million—an increase of $50 million, or 12 percent, compared with the prior fiscal year, even as customer rates are expected to stabilize in the years ahead.

“Property tax payments provide crucial resources to the many communities where we live and work, supporting everything from education to public safety. By continuing to make local investments in gas and electric infrastructure, we are not only creating one of the safest and most reliable energy systems in the country, including wildfire risk reduction programs and related efforts, we’re investing in the local economy and helping our communities thrive,” said Jason Wells, senior vice president and chief financial officer for PG&E.

PG&E invested more than $5.7 billion last year and expects to invest $5.9 billion this year to enhance and upgrade its gas and electrical infrastructure amid power line fire risks across Northern and Central California.

Some recent investments include the construction of PG&E’s $75 millionGas Safety Academy in Winters in Yolo County, which opened in September. Last year, PG&E opened a $36 million, state-of-the-art electric distribution control center in Rocklin.

PG&E supports the communities it serves in a variety of ways. In 2016, PG&E provided more than $28 million in charitable contributions to enrich local educational opportunities, preserve the environment, and support economic vitality and emergency preparedness and safety, including its Wildfire Assistance Program for impacted residents. PG&E employees provide thousands of hours of volunteer service in their local communities. The company also offers a broad spectrum of economic development services to help local businesses grow.


Related News

View more

Illinois electric utility publishes online map of potential solar capacity

ComEd Hosting Capacity Map helps Illinois communities assess photovoltaic capacity, distributed energy resources, interconnection limits, and grid planning needs, guiding developers and policymakers on siting solar, net metering feasibility, and RPS-aligned deployment by circuit.


Key Points

An online tool showing circuit-level DER capacity, PV limits, and interconnection readiness across ComEd.

✅ Circuit-level estimates of solar hosting capacity

✅ Guides siting, interconnection, and net metering

✅ Supports RPS goals with grid planning insights


As the Illinois solar market grows from the Future Energy Jobs Act, the largest utility in the state has posted a planning tool to identify potential PV capacity in their service territory. ComEd, a Northern Illinois subsidiary of Exelon, has a hosting capacity website for its communities indicating how much photovoltaic capacity can be sited in given areas, based on the existing electrical infrastructure, as utilities pilot virtual power plant programs that leverage distributed resources.

According to ComEd’s description, “Hosting Capacity is an estimate of the amount of DER [distributed energy resources] that may be accommodated under current configurations at the overall circuit level without significant system upgrades to address adverse impacts to power quality or reliability.” This website will enable developers and local decision makers to estimate how much solar could be installed by township, sections and fractions of sections as small as ½ mile by ½ mile and to gauge EV charging impacts with NREL's projection tool for distribution planning. The map sections indicate potential capacity by AC kilowatts with a link to to ComEd’s recently upgraded Interconnection and Net Metering homepage.

The Hosting Map can provide insight into how much solar can be installed in which locations in order to help solar reach a significant portion of the Illinois Renewable Portfolio Standard (RPS) of 25% electricity from renewable sources by 2025, and to plan for transportation electrification as EV charging infrastructure scales across utility territories. For example, the 18 sections of Oak Park Township capacity range from 612 to 909 kW, and total 13,260 kW of photovoltaic power. That could potentially generate around 20 million kWh, and policy actions such as the CPUC-approved PG&E EV program illustrate how electrification initiatives may influence future demand. Oak Park, according to the PlanItGreen Report Card, a joint project of the Oak Park River Forest Community Foundation and Seven Generations Ahead, uses about 325 million kWh.

Based on ComEd’s Hosting Capacity, Oak Park could generate about 6% of its electricity from solar power located within its borders. Going significantly beyond this amount would likely require a combination of upgrades by ComEd’s infrastructure, potentially higher interconnection costs and deployment of technologies like energy storage solutions. What this does indicate is that a densely populated community like Oak Park would most likely have to get the majority of its solar and renewable electricity from outside its boundaries to reach the statewide RPS goal of 25%. The Hosting Capacity Map shows a considerable disparity among communities in ½ mile by ½ mile sections with some able to host only 100-200 kWs to some with capacities of over 3,000 kW.


Related News

View more

California just made more clean energy than it needed

CAISO Net Negative Emissions signal moments when greenhouse gas intensity of serving ISO demand drops below zero, driven by high renewable generation, low load, strong solar exports, and imports accounting in the California grid.


Key Points

Moments when CAISO's CO2 to serve demand is below zero, driven by renewables, exports, and import accounting.

✅ Calculated using imports and exports to serve ISO demand

✅ Occur during high solar output, low weekend load

✅ Coincide with curtailment and record renewable penetration


We’re a long way from the land of milk and honey, but on Easter Sunday – for about an hour – we got a taste.

On Sunday, at 1:55 PM Pacific Time the California Independent Systems Operator (CAISO) reported that greenhouse gas emissions necessary to serve its demand (~80% of California’s electricity demand on an annual basis), was measured at a rate -16 metric tons of CO2 per hour. Five minutes later, the value was -2 mTCO2/h, before it crept back up to 40 mTCO2/h at 2:05 PM PST. At 2:10 PST though it fell back to -86 mTCO2/h and stayed negative until 3:05 PM PST, even as global CO2 emissions flatlined in 2019 according to the IEA.

This information was brought to the attention of pv magazine via tweet from eagle eye Jon Pa after CAISO’s site first noted the negative values:

The region was still generating CO2 though, as natural gas, biogas, biomass, geothermal and even coal plants were running and pumping out emissions, even as potent greenhouse gases declined in the US under control efforts. CAISO’s Greenhouse Gas Emission Tracking Methodology, December 28, 2016 (pdf) notes the below calculations to create the value what it terms, “Total GHG emissions to serve ISO demand”:

Of importance to note is that to get to the net negative value, CAISO considered all electricity imports and exports, a reminder that climate policy shapes grid operations across North America. And as can be noted in the image below the CO2 intensity of imports during the day rapidly declined as the sun came up, first going negative around 9:05 AM PST, and mostly staying so until just before 6 PM PST.

During this same weekend, other records were noted (reiterating that we’re in record setting season and as the state pursues its 100% carbon-free mandate now in law) such as a new electricity export record of greater than 2 GW and total renewable electricity as part of total demand at greater than 70%.

At the peak negative moment of 2:15 PM PST, -112 mTCO2/h seen below, the total amount of clean instantaneous generation being used in the power grid region was 17 GW, a far cry from heat-driven reliability strains like rolling blackout warnings that arise during extreme demand, with renewables giving 76% of the total, hydro 14%, nuclear 13% and imports of -12% countering the CO2 coming from just over 1.4 GW of gas generation.

Also of importance are a few layers of nuance in the electricity demand charts. First off we’re in the shoulder seasons  of California – nice cool weather before the warmth of summer drives air conditioning demand. Additional the weekend electricity demand is always lower, as well, Easter Sunday might have had an affect, whereas in colder regions Calgary’s electricity use can soar during frigid snaps.

Lastly to note was the amount of electricity from solar and wind generation being curtailed. And while the Sunday numbers weren’t available yet, the below image noted Saturday with 10 GWh in total being curtailed (pdf) – peaking at over 3.2 GW of instantaneous mostly solar power even as solar is now the cheapest electricity according to the IEA, in the hours of 2 and 3 PM PST. On an annualized basis, less than 2% of total potential solar electricity was curtailed in 2018.


Related News

View more

How Synchrophasors are Bringing the Grid into the 21st Century

Synchrophasors deliver PMU-based, real-time monitoring for the smart grid, helping NYISO prevent blackouts, cut costs, and integrate renewables, with DOE-backed deployments boosting reliability, situational awareness, and data sharing across regional partners.


Key Points

Synchrophasors, or PMUs, are grid sensors that measure synced voltage, current, and frequency to enhance reliability.

✅ Real-time grid visibility and situational awareness

✅ Early fault detection to prevent cascading outages

✅ Supports renewable integration and lowers operating costs


Have you ever heard of a synchrophasor? It may sound like a word out of science fiction, but these mailbox-sized devices are already changing the electrical grid as we know it.

The grid was born over a century ago, at a time when our needs were simpler and our demand much lower. More complex needs are putting a heavy strain on the aging infrastructure, which is why we need to innovate and update our grid with investments in a smarter electricity infrastructure so it’s ready for the demands of today.

That’s where synchrophasors come in.

A synchrophasor is a sophisticated monitoring device that can measure the instantaneous voltage, current and frequency at specific locations on the grid. This gives operators a near-real-time picture of what is happening on the system, including insights into power grid vulnerabilities that allow them to make decisions to prevent power outages.

Just yesterday I attended the dedication of the New York Independent System Operator's smart grid control center, a $75 million project that will use these devices to locate grid problems at an early stage and share these data with their regional partners. This should mean fewer blackouts for the State of New York. I would like to congratulate NYISO for being a technology leader.

And not only will these synchrophasors help prevent outages, but they also save money. By providing more accurate and timely data on system limits, synchrophasors make the grid more reliable and efficient, thereby reducing planning and operations costs and addressing grid modernization affordability concerns for utilities.

The Department has worked with utilities across the country to increase the number of synchrophasors five-fold -- from less than 200 in 2009 to over 1,700 today. And this is just a part of our commitment to making a smarter, more resilient grid a reality, reinforced by grid improvement funding from DOE.

In September 2013, the US Department of Energy announced up to $9 million in funding to facilitate rapid response to unusual grid conditions. As a result, utilities will be able to better detect and head off potential blackouts, while improving day-to-day grid reliability and helping with the integration of solar into the grid and other clean renewable sources.

If you’d like to learn more about our investments in the smart grid and how they are improving our electrical infrastructure, please visit the Office of Electricity Delivery and Energy Reliability’s www.smartgrid.gov.

Patricia Hoffman is Assistant Secretary, Office of Electricity Delivery & Energy Reliability


Related News

View more

Sign Up for Electricity Forum’s Newsletter

Stay informed with our FREE Newsletter — get the latest news, breakthrough technologies, and expert insights, delivered straight to your inbox.

Electricity Today T&D Magazine Subscribe for FREE

Stay informed with the latest T&D policies and technologies.
  • Timely insights from industry experts
  • Practical solutions T&D engineers
  • Free access to every issue

Download the 2025 Electrical Training Catalog

Explore 50+ live, expert-led electrical training courses –

  • Interactive
  • Flexible
  • CEU-cerified