Protective Relay Training - Basic
Our customized live online or in‑person group training can be delivered to your staff at your location.

- Live Online
- 12 hours Instructor-led
- Group Training Available
Regular Price:
$699
Coupon Price:
$599
LONDON
—
Nuclear Power Construction Milestones spotlight EPR builds, Hualong One steam generators, APR-1400 grid integration, and VVER startups, with hot functional testing, hydrostatic checks, and commissioning advancing toward fuel loading and commercial operation.
Understanding the Story
Key reactor project steps, from testing and grid readiness to startup, marking progress toward safe commercial operation.
EPR units advance via cold and hot functional testing phases
Flamanville 3 completes hydro tests; hot tests next, fuel load planned
Hualong One installs three steam generators at Fuqing 5
Barakah APR-1400 switchyard energized; Unit 2 prepped for hot tests
VVER projects reach criticality and MCRP, progressing to power ascension
The world’s nuclear power industry has been busy in the new year, with several construction projects, including U.S. reactor builds, reaching key milestones as 2018 began.
EPR Units Making Progress
Four EPR nuclear units are under construction in three countries: Olkiluoto 3 in Finland began construction in August 2005, Flamanville 3 in France began construction in December 2007, and Taishan 1 and 2 in China began construction in November 2009. Each of the new units is behind schedule and over budget, but recent progress may signal an end to some of the construction difficulties.
EDF reported that cold functional tests were completed at Flamanville 3 on January 6. The main purpose of the testing was to confirm the integrity of primary systems, and verify that components important to reactor safety were properly installed and ready to operate. More than 500 welds were inspected while pressure was held greater than 240 bar (3,480 psi) during the hydrostatic testing, which was conducted under the supervision of the French Nuclear Safety Authority.
With cold testing successfully completed, EDF can now begin preparing for hot functional tests, which verify equipment performance under normal operating temperatures and pressures. Hot testing is expected to begin in July, with fuel loading and reactor startup possible by year end. The company also reported that the total cost for the unit is projected to be €10.5 billion (in 2015 Euros, excluding interim interest).
Olkiluoto 3 began hot functional testing in December. Teollisuuden Voima Oyj—owner and operator of the site—expects the unit to produce its first power by the end of this year, with commercial operation now slated to begin in May 2019.
Although work on Taishan 1 began years after Olkiluoto 3 and Flamanville 3, it is the furthest along of the EPR units. Reports surfaced on January 2 that China General Nuclear (CGN) had completed hot functional testing on Taishan 1, and that the company expects the unit to be the first EPR to startup. CGN said Taishan 1 would begin commercial operation later this year, with Taishan 2 following in 2019.
Hualong One Steam Generators Installed
Another Chinese project reached a notable milestone on January 8. China National Nuclear Corp. announced the third of three steam generators had been installed at the Hualong One demonstration project, which is being constructed as Unit 5 at the Fuqing nuclear power plant.
The Hualong One pressurized water reactor unit, also known as the HPR 1000, is a domestically developed design, part of China’s nuclear program, based on a French predecessor. It has a 1,090 MW capacity. The steam generators reportedly weigh 365 metric tons and stand more than 21 meters tall. The first steam generator was installed at Fuqing 5 on November 10, with the second placed on Christmas Eve.
Barakah Switchyard Energized
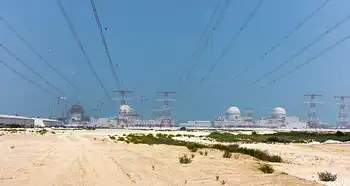
In the United Arab Emirates, more progress has been made on the four South Korean–designed APR-1400 units under construction at the Barakah nuclear power plant. On January 4, Emirates Nuclear Energy Corp. (ENEC) announced that the switchyard for Units 3 and 4 had been energized and connected to the power grid, a crucial step in Abu Dhabi toward completion. Unit 2’s main power transformer, excitation transformer, and auxiliary power transformer were also energized in preparation for hot functional testing on that unit.
“These milestones are a result of our extensive collaboration with our Prime Contractor and Joint Venture partner, the Korea Electric Power Corporation (KEPCO),” ENEC CEO Mohamed Al Hammadi said in a press release. “Working together and benefitting from the experience gained when conducting the same work on Unit 1, the teams continue to make significant progress while continuing to implement the highest international standards of safety, security and quality.”
In 2017, ENEC and KEPCO achieved several construction milestones including installation and concrete pouring for the reactor containment building liner dome section on Unit 3, and installation of the reactor containment liner plate rings, reactor vessel, steam generators, and condenser on Unit 4.
Construction began on the four units (Figure 1) in July 2012, May 2013, September 2014, and September 2015, respectively. Unit 1 is currently undergoing commissioning and testing activities while awaiting regulatory review and receipt of the unit’s operating license from the Federal Authority for Nuclear Regulation, before achieving 100% power in a later phase. According to ENEC, Unit 2 is 90% complete, Unit 3 is 79% complete, and Unit 4 is 60% complete.
VVER Units Power Up
On December 29, Russia’s latest reactor to commence operation—Rostov 4 near the city of Volgodonsk—reached criticality, as other projects like Leningrad II-1 advance across the fleet, and was operated at its minimum controlled reactor power (MCRP). Criticality is a term used in the nuclear industry to indicate that each fission event in the reactor is releasing a sufficient number of neutrons to sustain an ongoing series of reactions, which means the neutron population is constant and the chain reaction is stable.
“The transfer to the MCRP allows [specialists] to carry out all necessary physical experiments in the critical condition of [the] reactor unit (RU) to prove its design criteria,” Aleksey Deriy, vice president of Russian projects for ASE Engineering Co., said in a press release. “Upon the results of the experiments the specialists will decide on the RU powerup.”
Rostov 4 is a VVER-1000 reactor with a capacity of 1,000 MW. The site is home to three other VVER units: Unit 1 began commercial operation in 2001, Unit 2 in 2010, and Unit 3 in 2015.
Related News
Related News
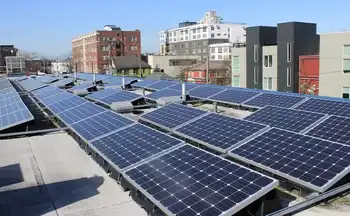
Maryland opens solar-power subscriptions to all
Maryland Community Solar Program enables renters and condo residents to subscribe to offsite solar, earn…
View more

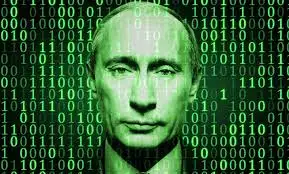
US Government Condemns Russia for Power Grid Hacking
Russian Cyberattacks on U.S. Critical Infrastructure target energy grids, nuclear plants, water systems, and aviation,…
View more

Russian hackers had 'hundreds of victims' as they infiltrated U.S. power grid
Russian cyberattacks on U.S. power grid exposed DHS warnings: Dragonfly/Energetic Bear breached control rooms, ICS…
View more
Windstorm Causes Significant Power Outages
Vancouver October 2024 Windstorm brought extreme weather to British Columbia, causing power outages, storm damage,…
View more
Dewa in China to woo renewable energy firms
Dewa-China Renewable Energy Partnership advances solar, clean energy, smart grid, 5G, cloud, and Big Data,…
View more
Russians hacked into US electric utilities: 6 essential reads
U.S. power grid cyberattacks expose critical infrastructure to Russian hackers, DHS warns, targeting SCADA, smart…
View more
Sign Up for Electricity Forum’s Newsletter
Stay informed with our FREE Newsletter — get the latest news, breakthrough technologies, and expert insights, delivered straight to your inbox.
Electricity Today T&D Magazine Subscribe for FREE

Stay informed with the latest T&D policies and technologies.
- Timely insights from industry experts
- Practical solutions T&D engineers
- Free access to every issue

