CSA Z462 Arc Flash Training – Electrical Safety Compliance Course
Our customized live online or in‑person group training can be delivered to your staff at your location.

- Live Online
- 6 hours Instructor-led
- Group Training Available
Regular Price:
$249
Coupon Price:
$199
Grid Resilience in North America is strengthening as utilities harden networks against solar storms and geomagnetic disturbances, with Hydro-Qu�e9bec, Hydro One, and NOAA alerts, smart grid controls, series compensation, and vegetation management reducing cascading blackouts.
Essential Takeaways
The grid's ability to withstand and quickly recover from solar storms and weather via smart controls and hardening.
- 1989 solar storm blacked out Quebec for 9+ hours in winter.
- Hydro-Qu�e9bec recalibrated trips and added $1.2B series compensation.
- Utilities use NOAA and NERC alerts for geomagnetic disturbances.
- Ontario's Grid Control Center enables rapid, wide-area switching.
- Smart grid monitoring and vegetation management cut cascading risks.
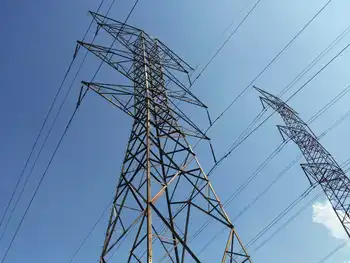
The North American power grid is an incredibly complex system, with a web of more than 340,000 kilometres of high-voltage transmission lines connecting thousands of generating stations, tens of thousands of transformers and control stations, and millions of homes and businesses. It's often taken for granted — until the lights go out.
Mother Nature has a way of finding weaknesses in the system and wreaking havoc on a grand scale. Besides regular localized power failures caused by storms, she's managed to take out electricity to huge swaths of North America's grid at least once each decade since the 1950s.
From each major failure the engineers have learned new lessons, and as they make the electrical grid "smarter" they're also trying to make it tougher. But are we any better prepared today for what the environment throws at the continent-spanning power system that has become crucial to modern life?
On March 13, 1989, for example, a violent solar storm knocked out power across Quebec for more than nine hours during the chilly tail end of winter. The blast of energy and plasma from the sun also caused smaller blackouts and damage to electricity infrastructure in other parts of North America.
According to the U.S. National Oceanographic and Atmospheric Administration NOAA, the storm cost Hydro-Québec and Public Service Electric and Gas of New Jersey more than $30 million, putting the event on par with damage caused by hurricanes and earthquakes.
The sun's activity is increasing again on the way to the next peak of the solar cycle, which NOAA expects in May 2013. Meanwhile, North America's grid has aged another 22 years.
That doesn't worry Quebec's main utility, which says its infrastructure has improved with time.
Within months of the blackout, Hydro-Québec had recalibrated the trip levels for safety equipment across the grid to reduce the chance it would be triggered by a solar storm. Later, it added equipment called series compensation on some lines to increase the stability of the network by changing the electrical behaviour of its transmission lines — a project completed in 1996.
According to NOAA, those upgrades cost $1.2 billion.
Hydro-Québec has also created an alert system to measure disturbances in the grid during magnetic storms, targeting certain substations in an effort to get an overview of the whole grid.
Spokeswoman Flavie Côté said in an email to CBC News that the grid is more robust than it was in 1989.
"The performance of the network in similar situations since then leads us to believe in the strength of the system," she added.
Ontario's Hydro One receives early warnings about solar activity from the North American Electric Reliability Corporation, and has sensors and other equipment that helps dissipate the impact of solar disturbances, spokeswoman Daniele Gauvin said.
It seems like the upgrades are working. On February 18 this year, a massive solar flare and blast of plasma from the sun hit the Earth's atmosphere, creating a brilliant display of lights in Northern Canada but causing no damage to the country's electrical grid.
Solar flares aren't the only things on the minds of power grid troubleshooters.
Quebec and Ontario have survived a number of major blackouts, including the ice storm of 1998 that hit both provinces hard, and affected people right across to Canada's east coast and the northern U.S. The sheer weight of ice on the transmission lines dragged them right off their towers, and in some cases flattened the towers themselves.
It's hard to protect the system of high-tension wires against a storm of that geographic size and magnitude, but the grid has also been brought to its knees by relatively simple, localized problems – such as trees.
Ontarians were among the 50 million people hit by the largest power outage in North American history on Aug. 14, 2003. The incident shut down hundreds of power plants in Ontario and eight U.S. states, left some areas without power for several days and suspended Ontario power markets for more than a week. The origin of the outage was traced to Ohio, where tree branches came into contact with sagging electrical lines and caused a cascade of other failures, according to an expert report by the U.S.-Canada Power System Outage Task Force.
Ontario's Hydro One says it is far better prepared for problems on the grid than it was then.


In 2005, it opened its Ontario Grid Control Center to monitor and control the flow of electricity across the province, including disturbances. Before it was built, Ontario relied on smaller control centres that monitored individual pockets of the grid for potential situations. The blackout was "definitely a major component" in the decision to bring the centre together, said John Hamilton, manager of grid operations for distribution at Hydro One.
"The problem with individual-pocketing anything is... you can't see what impact outside of your pocket the situation is going to cause," Hamilton said.
The system proved itself last summer, when a problem arose at the Manby Transformer Station in Toronto, cutting power to a section of the city. That could have cascaded and created other blackouts like the 2003 Ohio incident, but it didn't. In fact, Hydro One managed to restore power relatively quickly.
"We could see all the information at once," Hamilton said, "and we could immediately start planning how to switch around the issues that arose."
Ontario, like many other North American regions, is moving towards a smart grid — one with a built-in information infrastructure that allows the entire grid to be monitored and controlled from a distance.
That isn't yet in place for the high-tech distribution side of the network, which carries power from the transmission network to customers. But Hydro One's transmission network — the part of the grid that would likely be most affected by solar storms, among other things — already is practically a smart grid, Hamilton said. The people overseeing the system can monitor current at different locations, remotely turn power on and off, and dispatch crews to the areas it believe there could be a problem.
Consequently, Hydro One thinks it, too, is ready for the coming peak of the solar-storm cycle as well as other environmental challenges.
In the meantime, mindful of Mother Nature's surprises, it is keeping a close eye on both the grid and the skies.
Related News
Related News
EU draft shows plan for more fixed-price electricity contracts
EU Electricity Market Reform advances two-way CfDs, PPAs, and fixed-price tariffs to cut volatility, support…
View more
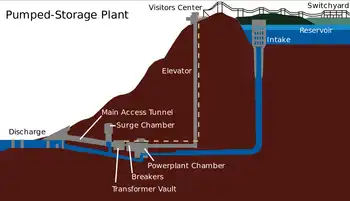
Hydroelectricity Under Pumped Storage Capacity
Pumped Storage Hydroelectricity balances renewable energy, stabilizes the grid, and provides large-scale energy storage using…
View more

Manitoba Hydro seeks unpaid days off to trim costs during pandemic
Manitoba Hydro unpaid leave plan offers unpaid days off to curb workforce costs amid COVID-19,…
View more

Canadian Gov't and PEI invest in new transmission line to support wind energy production
Skinners Pond Transmission Line expands PEI's renewable energy grid, enabling wind power integration, grid reliability,…
View more

Britons could save on soaring bills as ministers plan to end link between gas and electricity prices
UK Electricity-Gas Price Decoupling aims to reform wholesale electricity pricing under the Energy Security Bill,…
View more
Report: Duke Energy to release climate report under investor pressure
Duke Energy zero-coal 2050 plan outlines a decarbonized energy mix, aligning with Paris goals, cutting…
View more
Sign Up for Electricity Forum’s Newsletter
Stay informed with our FREE Newsletter — get the latest news, breakthrough technologies, and expert insights, delivered straight to your inbox.
Electricity Today T&D Magazine Subscribe for FREE

Stay informed with the latest T&D policies and technologies.
- Timely insights from industry experts
- Practical solutions T&D engineers
- Free access to every issue

