
NFPA 70E Training
Our customized live online or in‑person group training can be delivered to your staff at your location.

- Live Online
- 6 hours Instructor-led
- Group Training Available
Regular Price:
$199
Coupon Price:
$149
SAINT PAUL
—
Minnesota 100% Carbon-Free Electricity advances renewable energy: wind, solar, hydropower, hydrogen, biogas from landfill gas and anaerobic digestion; excludes incineration in environmental justice areas; uses renewable energy credits and streamlined permitting.
A Closer Look
Minnesota's mandate requires utilities to deliver 100% carbon-free power by 2040 with targets and EJ safeguards.
100% carbon-free by 2040; 90% by 2035; 80%/60% by 2030 tiers.
55% renewable generation by 2035; RECs allowed for compliance.
Approved: wind, solar, certain hydro, hydrogen, landfill gas, AD.
EJ areas: incinerator power excluded; permitting streamlined.
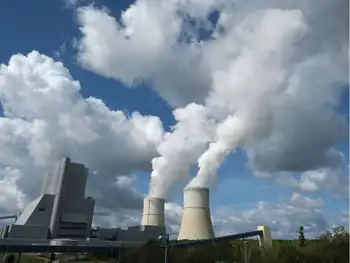
Minnesota Gov. Tim Walz, D, is expected to soon sign a bill establishing a clean electricity standard requiring utilities in the state to provide electricity from 100% carbon-free sources by 2040. The bill also calls for utilities to generate at least 55% of their electricity from renewable energy sources by 2035, a trajectory similar to New Mexico's clean electricity push underway this decade.
Electricity generated from landfill gas and anaerobic digestion are named as approved renewable energy technologies, but electricity generated from incinerators operating in “environmental justice areas”, reflecting concerns about renewable facilities violating pollution rules in some states, will not be counted toward the goal. Wind, solar, and certain hydropower and hydrogen energy sources are also considered renewable in the bill.
The bill defines EJ areas as places where at least 40% of residents are not white, 35% of households have an income that’s below 200% of the federal poverty line, and 40% or more of residents over age 5 have “limited” English proficiency. Areas the U.S. state defines as “Indian country” are also considered EJ areas.
Some of the state’s largest electric utilities, like Xcel Energy and Minnesota Power, have already pledged to move to carbon-free energy, and utilities such as Alliant Energy have outlined carbon-neutral plans in the region, but this bill speeds up that goal by 10 years, Minnesota Public Radio reported. The bill calls for public utilities operating in the state to be 80% carbon-free and other electric utilities to be 60% carbon-free by 2030. All utilities must be 90% carbon-free by 2035 before ultimately hitting the 100% mark in 2040, according to the bill.
The bill gives utilities some leniency if they demonstrate to state regulators that they can’t offer affordable power while working toward the benchmarks, acknowledging reliability challenges seen in places like California's grid during the clean energy transition. It also allows utilities to buy renewable energy credits to meet the standard instead of generating the energy themselves.
Patrick Serfass, executive director of the American Biogas Council, said the bill will incentivize more biogas-related electricity projects, “which means the recycling of more organic material and more renewable electricity in the state. Those are all good things,” he said. ABC sees significant potential for biogas production in Minnesota, though the federal climate law has delivered mixed results for accelerating clean power deployment.
The bill also aims to streamline the permitting process for new energy projects in the state, even as some states consider limits on clean energy that would constrain utility use, and calls for higher minimum wage requirements for workers.
Related News
Related News
Opinion: Germany's drive for renewable energy is a cautionary tale
Germany Energiewende Lessons highlight climate policy tradeoffs, as renewables, wind and solar face grid constraints,…
View more
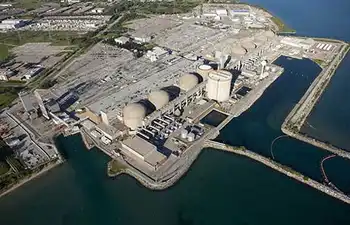
Ontario explores possibility of new, large scale nuclear plants
Ontario Nuclear Expansion aims to meet rising electricity demand and decarbonization goals, complementing renewables with…
View more
Integrating AI Data Centers into Canada's Electricity Grids
Canada AI Data Center Grid Integration aligns AI demand with renewable energy, energy storage, and…
View more
Hydro One deal to buy Avista receives U.S. antitrust clearance
Hydro One-Avista Acquisition secures U.S. antitrust clearance under Hart-Scott-Rodino, pending approvals from state utility commissions,…
View more

LNG powered with electricity could be boon for B.C.'s independent power producers
B.C. LNG Electrification embeds clean hydro and wind power into low-emission liquefied natural gas, cutting…
View more
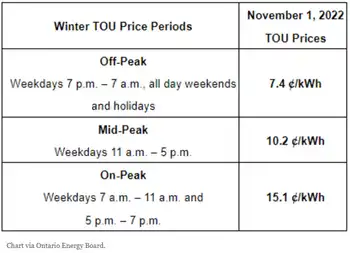
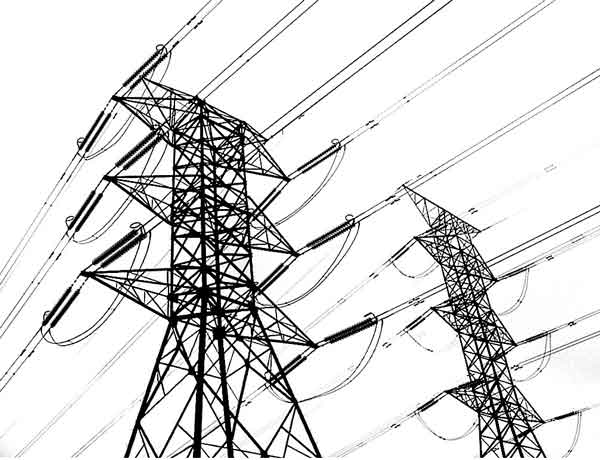
Electricity rates are about to change across Ontario
Ontario Electricity Rate Changes lower OEB Regulated Price Plan costs, adjust Time-of-Use winter hours and…
View more
Sign Up for Electricity Forum’s Newsletter
Stay informed with our FREE Newsletter — get the latest news, breakthrough technologies, and expert insights, delivered straight to your inbox.
Electricity Today T&D Magazine Subscribe for FREE

Stay informed with the latest T&D policies and technologies.
- Timely insights from industry experts
- Practical solutions T&D engineers
- Free access to every issue
