Nissan accepting electricity from EVs as payment for parking


nissan ev parking

Arc Flash Training - CSA Z462 Electrical Safety

Our customized live online or in‑person group training can be delivered to your staff at your location.

  • Live Online
  • 6 hours Instructor-led
  • Group Training Available
Regular Price:
$249
Coupon Price:
$199
Reserve Your Seat Today

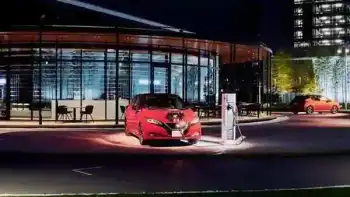
Nissan V2G Parking lets EV drivers pay with electricity via bidirectional charging at the Yokohama Nissan Pavilion, showcasing vehicle-to-grid, smart energy trading, and integrated mobility experiences like Ariya rides and Formula E simulators.


Key Points

A program where EV owners use V2G to pay for parking by discharging power at Nissan's Yokohama Pavilion.

✅ Pay for parking with EV energy via V2G

✅ Powered by Nissan LEAFs and solar at the Pavilion

✅ Showcases Ariya, Formula E, ProPILOT, and I2V tech


Nissan is letting customers pay for parking with electricity by discharging power from their electric car’s battery pack, a concept similar to how EV owners sell electricity back to the grid in other programs. In what the company claims to be a global first, owner of electric cars can trade energy for a parking space at Nissan Pavilion exhibition space in Yokohama, Japan, echoing how parked EVs earn from Europe's grids in comparable schemes.

The venue that showcases Nissan's future technologies, opened its doors to public on August 1 and will remain so through October 23, underscoring how stored EV energy can power buildings in broader applications. “(It) is a place where customers can see, feel, and be inspired by (the company's) near-future vision for society and mobility," says CEO Makoto Uchida. “As the world shifts to electric mobility, EVs will be integrated into society in ways that go beyond just transportation."

Apart from the innovate parking experience, people visiting the pavilion can also virtually experience the thrill of Formula E electric street racing or go for a ride in the all-new Ariya electric crossover, similar to demos at the Everything Electric show in Vancouver. Other experiences include ProPILOT advanced driver assistance system as well as Nissan’s Invisible-to-Visible (I2V) technology, which combines information from the real and virtual worlds to assist drivers, themes also explored at an EV education centre in Toronto for public outreach.

A mobility hub in front of the Pavilion offers a variety of services including EV car-sharing. The Pavilion also operates a cafe operated on power supplied by Nissan LEAF electric cars and solar energy, showcasing vehicle-to-building charging benefits on site.

As part of its Nissan NEXT transformation plan, the company plans to expand its global lineup of EVs and aims to sell more than 1 million electrified vehicles a year by the end of fiscal 2023, aligning with the American EV boom and the challenge of scaling charging infrastructure.


Related News

Related News

UK low-carbon electricity generation stalls in 2019

UK low-carbon electricity 2019 saw stalled growth as renewables rose slightly, wind expanded, nuclear output fell, coal hit record lows, and net-zero targets demand faster deployment to cut CO2 intensity below 100gCO2/kWh.


Key Points

Low-carbon sources supplied 54% of UK power in 2019, up just 1TWh; wind grew, nuclear fell, and coal dropped to 2%.

✅ Wind up 8TWh; nuclear down 9TWh amid outages

✅ Fossil fuels 43% of generation; coal at 2%

✅ Net-zero needs 15TWh per year added to 2030


The amount of electricity generated by low-carbon sources in the UK stalled in 2019, Carbon Brief analysis shows.

Low-carbon electricity output from wind, solar, nuclear, hydro and biomass rose by just 1 terawatt hour (TWh, less than 1%) in 2019. It represents the smallest annual increase in a decade, where annual growth averaged 9TWh. This growth will need to double in the 2020s to meet UK climate targets while replacing old nuclear plants as they retire.

Some 54% of UK electricity generation in 2019 came from low-carbon sources, including 37% from renewables and 20% from wind alone, underscoring wind's leading role in the power mix during key periods. A record-low 43% was from fossil fuels, with 41% from gas and just 2% from coal, also a record low. In 2010, fossil fuels generated 75% of the total.

Carbon Brief’s analysis of UK electricity generation in 2019 is based on figures from BM Reports and the Department for Business, Energy and Industrial Strategy (BEIS). See the methodology at the end for more on how the analysis was conducted.

The numbers differ from those published earlier in January by National Grid, which were for electricity supplied in Great Britain only (England, Wales and Scotland, but excluding Northern Ireland), including via imports from other countries.

Low-carbon low
In 2019, the UK became the first major economy to target net-zero greenhouse gas emissions by 2050, increasing the ambition of its legally binding Climate Change Act.

To date, the country has cut its emissions by around two-fifths since 1990, with almost all of its recent progress coming from the electricity sector.

Emissions from electricity generation have fallen rapidly in the decade since 2010 as coal power has been almost phased out and even gas output has declined. Fossil fuels have been displaced by falling demand and by renewables, such as wind, solar and biomass.

But Carbon Brief’s annual analysis of UK electricity generation shows progress stalled in 2019, with the output from low-carbon sources barely increasing compared to a year earlier.

The chart below shows low-carbon generation in each year since 2010 (grey bars) and the estimated level in 2019 (red). The pale grey bars show the estimated future output of existing low-carbon sources after old nuclear plants retire and the pale red bars show the amount of new generation needed to keep electricity sector emissions to less than 100 grammes of CO2 per kilowatt hour (gCO2/kWh), the UK’s nominal target for the sector.

 Annual electricity generation in the UK by fuel, terawatt hours, 2010-2019. Top panel: fuel by fuel. Bottom panel: cumulative total generation from all sources. Source: BEIS energy trends, BM Reports and Carbon Brief analysis. Chart by Carbon Brief using Highcharts.
As the chart shows, the UK will require significantly more low-carbon electricity over the next decade as part of meeting its legally binding climate goals.

The nominal 100gCO2/kWh target for 2030 was set in the context of the UK’s less ambitious goal of cutting emissions to 80% below 1990 levels by 2050. Now that the country is aiming to cut emissions to net-zero by 2050, that 100gCO2/kWh indicator is likely to be the bare minimum.

Even so, it would require a rapid step up in the pace of low-carbon expansion, compared to the increases seen over the past decade. On average, low-carbon generation has risen by 9TWh each year in the decade since 2010 – including a rise of just 1TWh in 2019.

Given scheduled nuclear retirements and rising demand expected by the Committee on Climate Change (CCC) – with some electrification of transport and heating – low-carbon generation would need to increase by 15TWh each year until 2030, just to meet the benchmark of 100gCO2/kWh.

For context, the 3.2 gigawatt (GW) Hinkley C new nuclear plant being built in Somerset will generate around 25TWh once completed around 2026. The world’s largest offshore windfarm, the 1.2GW Hornsea One scheme off the Yorkshire coast, will generate around 5TWh each year.

The new Conservative government is targeting 40GW of offshore wind by 2030, up from today’s figure of around 8GW. If policies are put in place to meet this goal, then it could keep power sector emissions below 100gCO2/kWh, depending on the actual performance of the windfarms built.

However, new onshore wind and solar, further new nuclear or other low-carbon generation, such as gas with carbon capture and storage (CCS), is likely to be needed if demand is higher than expected, or if the 100gCO2/kWh benchmark is too weak in the context of net-zero by 2050.

The CCC says it is “likely” to “reflect the need for more rapid deployment” of low-carbon towards net-zero emissions in its advice on the sixth UK carbon budget for 2033-2037, due in September.

Trading places
Looking more closely at UK electricity generation in 2019, Carbon Brief’s analysis shows why there was so little growth for low-carbon sources compared to the previous year.

There was another increase for wind power in 2019 (up 8TWh, 14%), with record wind generation as several large new windfarms were completed including the 1.2GW Hornsea One project in October and the 0.6GW Beatrice offshore windfarm in Q2 of 2019. But this was offset by a decline for nuclear (down 9TWh, 14%), due to ongoing outages for reactors at Hunterston in Scotland and Dungeness in Kent.

(Analysis of data held by trade organisation RenewableUK suggests some 0.6GW of onshore wind capacity also started operating in 2019, including the 0.2GW Dorenell scheme in Moray, Scotland.)

As a result of these movements, the UK’s windfarms overtook nuclear for the first time ever in 2019, becoming the country’s second-largest source of electricity generation, and earlier, wind and solar together surpassed nuclear in the UK as momentum built. This is shown in the figure below, with wind (green line, top panel) trading places with nuclear (purple) and gas (dark blue) down around 25% since 2010 but remaining the single-largest source.

 Annual electricity generation in the UK by fuel, terawatt hours, 2010-2019. Top panel: fuel by fuel. Bottom panel: cumulative total generation from all sources. Source: BEIS energy trends, BM Reports and Carbon Brief analysis. Chart by Carbon Brief using Highcharts.
The UK’s currently suspended nuclear plants are due to return to service in January and March, according to operator EDF, the French state-backed utility firm. However, as noted above, most of the UK’s nuclear fleet is set to retire during the 2020s, with only Sizewell B in Suffolk due to still be operating by 2030. Hunterston is scheduled to retire by 2023 and Dungeness by 2028.

Set against these losses, the UK has a pipeline of offshore windfarms, secured via “contracts for difference” with the government, at a series of auctions. The most recent auction, in September 2019, saw prices below £40 per megawatt hour – similar to current wholesale electricity prices.

However, the capacity contracted so far is not sufficient to meet the government’s target of 40GW by 2030, meaning further auctions – or some other policy mechanism – will be required.

Coal zero
As well as the switch between wind and nuclear, 2019 also saw coal fall below solar for the first time across a full year, echoing the 2016 moment when wind outgenerated coal across the UK, after it suffered another 60% reduction in electricity output. Just six coal plants remain in the UK, with Aberthaw B in Wales and Fiddlers Ferry in Cheshire closing in March.

Coal accounted for just 2% of UK generation in 2019, a record-low coal share since centralised electricity supplies started to operate in 1882. The fuel met 40% of UK needs as recently as 2012, but has plummeted thanks to falling demand, rising renewables, cheaper gas and higher CO2 prices.

The reduction in average coal generation hides the fact that the fuel is now often not required at all to meet the UK’s electricity needs. The chart below shows the number of days each year when coal output was zero in 2019 (red line) and the two previous years (blue).

 Cumulative number of days when UK electricity generation from renewable sources has been higher than that from fossil fuels. Source: BEIS energy trends, BM Reports and Carbon Brief analysis. Chart by Carbon Brief using Highcharts.
The 83 days in 2019 with zero coal generation amount to nearly a quarter of the year and include the record-breaking 18-day stretch without the fuel.

Great Britain has been running for a record TWO WEEKS without using coal to generate electricity – the first time this has happened since 1882.

The country’s grid has been coal-free for 45% of hours in 2019 so far.https://www.carbonbrief.org/countdown-to-2025-tracking-the-uk-coal-phase-out …

Coal generation was set for significant reductions around the world in 2019 – including a 20% reduction for the EU as a whole – according to analysis published by Carbon Brief in November.

Notably, overall UK electricity generation fell by another 9TWh in 2019 (3%), bringing the total decline to 58TWh since 2010. This is equivalent to more than twice the output from the Hinkley C scheme being built in Somerset. As Carbon Brief explained last year, falling demand has had a similar impact on electricity-sector CO2 emissions as the increase in output from renewables.

This is illustrated by the fact that the 9TWh reduction in overall generation translated into a 9TWh (6%) cut in fossil-fuel generation during 2019, with coal falling by 10TWh and gas rising marginally.

Increasingly renewable
As fossil-fuel output and overall generation have declined, the UK’s renewable sources of electricity have continued to increase. Their output has risen nearly five-fold in the past decade and their share of the UK total has increased from 7% in 2010 to 37% in 2019.

As a result, the UK’s increasingly renewable grid is seeing more minutes, hours and days during which the likes of wind, solar and biomass collectively outpace all fossil fuels put together, and on some days wind is the main source as well.

The chart below shows the number of days during each year when renewables generated more electricity than fossil fuels in 2019 (red line) and each of the previous four years (blue lines). In total, nearly two-fifths of days in 2019 crossed this threshold.

 Cumulative number of days when the UK has not generated any electricity from coal. Source: BEIS energy trends, BM Reports and Carbon Brief analysis. Chart by Carbon Brief using Highcharts.
There were also four months in 2019 when renewables generated more of the UK’s electricity than fossil fuels: March, August, September and December. The first ever such month came in September 2018 and more are certain to follow.

National Grid, which manages Great Britain’s high-voltage electricity transmission network, is aiming to be able to run the system without fossil fuels by 2025, at least for short periods. At present, it sometimes has to ask windfarm operators to switch off and gas plants to start running in order to keep the electricity grid stable.

Note that biomass accounted for 11% of UK electricity generation in 2019, nearly a third of the total from all renewables. Some two-thirds of the biomass output is from “plant biomass”, primarily wood pellets burnt at Lynemouth in Northumberland and the Drax plant in Yorkshire. The remainder was from an array of smaller sites based on landfill gas, sewage gas or anaerobic digestion.

The CCC says the UK should “move away” from large-scale biomass power plants, once existing subsidy contracts for Drax and Lynemouth expire in 2027.

Using biomass to generate electricity is not zero-carbon and in some circumstances could lead to higher emissions than from fossil fuels. Moreover, there are more valuable uses for the world’s limited supply of biomass feedstock, the CCC says, including carbon sequestration and hard-to-abate sectors with few alternatives.

Methodology
The figures in the article are from Carbon Brief analysis of data from BEIS Energy Trends chapter 5 and chapter 6, as well as from BM Reports. The figures from BM Reports are for electricity supplied to the grid in Great Britain only and are adjusted to include Northern Ireland.

In Carbon Brief’s analysis, the BM Reports numbers are also adjusted to account for electricity used by power plants on site and for generation by plants not connected to the high-voltage national grid. This includes many onshore windfarms, as well as industrial gas combined heat and power plants and those burning landfill gas, waste or sewage gas.

By design, the Carbon Brief analysis is intended to align as closely as possible to the official government figures on electricity generated in the UK, reported in BEIS Energy Trends table 5.1.

Briefly, the raw data for each fuel is in most cases adjusted with a multiplier, derived from the ratio between the reported BEIS numbers and unadjusted figures for previous quarters.

Carbon Brief’s method of analysis has been verified against published BEIS figures using “hindcasting”. This shows the estimates for total electricity generation from fossil fuels or renewables to have been within ±3% of the BEIS number in each quarter since Q4 2017. (Data before then is not sufficient to carry out the Carbon Brief analysis.)

For example, in the second quarter of 2019, a Carbon Brief hindcast estimates gas generation at 33.1TWh, whereas the published BEIS figure was 34.0TWh. Similarly, it produces an estimate of 27.4TWh for renewables, against a BEIS figure of 27.1TWh.

National Grid recently shared its own analysis for electricity in Great Britain during 2019 via its energy dashboard, which differs from Carbon Brief’s figures.


Related News

View more

Hydro One and Alectra announce major investments to strengthen electricity infrastructure and improve local reliability in the Hamilton area

Hydro One and Alectra Hamilton Grid Upgrades will modernize electricity infrastructure with new transformers, protection devices, transmission and distribution improvements, tree trimming, pole replacements, and line refurbishments to boost reliability and reduce outages across region.


Key Points

A $250M plan to modernize Hamilton transmission and distribution, reducing outages and improving reliability by 2022.

✅ New transformers and protection devices to cut outages

✅ Refurbished 1915 line powering Hamilton West Mountain

✅ Tree trimming and pole replacements across 1,260 km


Hydro One Networks Inc. (Hydro One), Ontario's largest electricity transmission and distribution company whose delivery rates recently increased, and Alectra Utilities have announced they expect to complete approximately $250 million of work in the Hamilton area by 2022 to upgrade local electricity infrastructure and improve service reliability.

As part of these plans to strengthen the electricity grid in the Hamilton region, where utilities must adapt to climate change pressures, investments are expected to include:

installing quieter, more efficient transformers in four stations across Hamilton to assist in reducing the number of outages;
replacing protection and switching devices across the city to shorten outage restoration times, reflecting how transmission line work underpins reliability;
refurbishing a power line originally installed in 1915 that is critical to powering the Hamilton West Mountain area; and,
trimming hazardous trees across more than 1,260 km of overhead powerlines and replacing more than 270 poles.
Hydro One will be working with Alectra Utilities to replace aging infrastructure at Elgin transmission station.

"A loss of power grinds life to a halt, impacting businesses, families and productivity. That's why Hydro One is partnering with Alectra Utilities to support a growing local economy in Hamilton, while improving power reliability for its residents," said Jason Fitzsimmons, Chief Corporate Affairs and Customer Care Officer. "Replacing aging infrastructure and modernizing equipment is part of our plan to build a stronger, safer and more reliable electricity system for Ontario now and into the future." 

"Partnering with Hydro One to invest in our local community will create a safer, more resilient and reliable system for the future," said Max Cananzi, President, Alectra Utilities.  "In addition to investments in the transmission system, Alectra Utilities also plans to invest $235 million over the next five years to renew, upgrade and connect customers to the electrical distribution and supporting systems in Hamilton. Investments in the transmission and distribution systems in Hamilton will contribute to the long-term sustainability of our communities."

"I am pleased to see Hydro One and Alectra investing in modernizing local electricity infrastructure and improving reliability," said Member of Provincial Parliament, Donna Skelly.  "Safe and reliable power is essential to supporting local families, businesses and our community."

Across Ontario, First Nations call for action on urgently needed transmission lines highlight the importance of timely grid investments.

Hydro One's investments included in this announcement are captured in its previously disclosed future capital expenditures, amid proposed projects like the Meaford hydro project across Ontario.

Much of Hydro One's electricity system was built in the 1950s, and replacing aging assets is critical as delays affecting a cross-border transmission line elsewhere have shown. Its three-year, $5 billion investment plan supports safe and reliable power to communities across Ontario, and strong regulatory oversight illustrated by the ATCO Electric penalty helps maintain public trust.


Related News

View more

Reliability of power winter supply puts Newfoundland 'at mercy of weather': report

Labrador Island Link Reliability faces scrutiny as Nalcor Energy and General Electric address software issues; Liberty Consulting warns of Holyrood risks, winter outages, grid stability concerns, and PUB oversight for Newfoundland and Labrador.


Key Points

It is the expected dependability of the link this winter, currently uncertain due to GE software and Holyrood risks.

✅ GE software delays may hinder reliable in-service by mid-November.

✅ Holyrood performance issues increase winter outage risk.

✅ PUB directs Hydro to plan contingencies and improve assets.


An independent consultant is questioning if the brand new Labrador Island link can be counted on to supply power to Newfoundland this coming winter.

In June, Nalcor Energy confirmed it had successfully sent power from Churchill Falls to the Avalon Peninsula through its more than 1500-kilometre link, but now the Liberty Consulting Group says it doesn't expect the link will be up and running consistently this winter.

"What we have learned supports a conclusion that the Labrador Island Link is unlikely to be reliably in commercial operation at the start of the winter," says the report dated Aug. 30, 2018.

The link relies on software provided by General Electric but Liberty says there are lingering questions about GE's ability to ensure the necessary software will be in place this fall.

"At an August meeting, company representatives did not express confidence in GE's ability to meet an in-service date for the Labrador Island Link of mid-November," says the report.

Liberty also says testing the link for a brief period this spring and fall doesn't demonstrate long-term reliability.

"The link will remain prone to the uncertainties any new major facility faces early in its operating life, especially one involving technology new to the operating company," according to the report.

Holyrood trouble

The report goes on to say island residents should also be worried about the reliability of the troubled Holyrood facility — a facility that's important when demand for energy is high during winter months.

Liberty says "poor performance at the Holyrood thermal generating station increases the risk of outages considerably."

The group's report concludes the deteriorating condition of Holyrood is a major threat to the island's power supply and Liberty says that threat "could produce very severe consequences when the Labrador Island Link is unavailable."

The consultant says questions about the Labrador Island Link's readiness combined with concerns about the reliability of Holyrood may mean power outages, and for vulnerable customers, debates over hydro disconnections policies often intensify during winter.

"This all suggests that, for at least part of this winter, the island interconnected system may be at the mercy of the weather, where severe events can test utilities' storm response efforts further."

The consultant's report also includes five recommendations to the PUB, reflecting the kind of focused nuclear alert investigation follow-up seen elsewhere.

In essence, Liberty is calling for the board to direct Newfoundland and Labrador Hydro to make plans for the possibility that the link won't be available this winter. It's also calling on hydro to do more to improve the reliability of its other assets, such as Holyrood, as some operators have even contemplated locking down key staff to maintain operations during crises.

Response to Liberty's report

Nalcor CEO Stan Marshall defended the Crown corporation's winter preparedness in an email statement to CBC.

"The right level of planning and investment has been made for our existing equipment so we can continue to meet all of our customer electricity needs for this coming winter season," he wrote.

Regarding the Labrador Island Link, Marshall called for patience.

"This is new technology for our province and integrating the new transmission assets into our current electricity system is complex work that takes time," he said.

There is also a more detailed response from Newfoundland and Labrador Hydro which was sent to the province's Public Utiltiies Board.

Hydro says it will keep testing the Labrador Island Link and increasing the megawatts that are wheeled through it. It also says in October it will begin to give the PUB regular reports on the link's anticipated in-service date.


Related News

View more

Almost 500-mile-long lightning bolt crossed three US states

Longest Lightning Flash Record confirmed by WMO: a 477.2-mile megaflash spanning Mississippi, Louisiana, and Texas, detected by satellite sensors, highlighting Great Plains supercell storms, lightning safety, and extreme weather monitoring advancements.


Key Points

It is the WMO-verified 477.2-mile megaflash across MS, LA, and TX, detected via satellites.

✅ Spanned 477.2 miles across Mississippi, Louisiana, and Texas

✅ Verified by WMO using space-based lightning detection

✅ Occurs in megaflash-prone regions like the U.S. Great Plains


An almost 500-mile long bolt of lightning that lit up the sky across three US states has set a new world record for longest flash, scientists have confirmed.

The lightning bolt, extended a total of 477.2 miles (768 km) and spread across Mississippi, Louisiana, and Texas.

The previous record was 440.6 miles (709 km) and recorded in Brazil in 2018.

Lightning rarely extends over 10 miles and usually lasts under a second, yet utilities plan for severe weather when building long-distance lines such as the TransWest Express transmission project to enhance reliability.

Another lightning flash recorded in 2020 - in Uruguay and Argentina - has also set a new record for duration at 17.1 seconds. The previous record was 16.7 seconds.

"These are extraordinary records from lightning flash events," Professor Randall Cerveny, the WMO's rapporteur of weather and climate extremes, said.

According to the WMO, both records took place in areas prone to intense storms that produce 'megaflashes', namely the Great Plains region of the United States and the La Plata basin of South America's southern cone, where utilities adapting to climate change is an increasing priority.

Professor Cerveny added that greater extremes are likely to exist and are likely to be recorded in the future thanks to advances in space-based lightning detection technology.

The WMO warned that lightning was a hazard and urged people in both regions and around the world to take caution during storms, which can lead to extensive disruptions like the Tennessee power outages reported after severe weather.

"These extremely large and long-duration lightning events were not isolated but happened during active thunderstorms," lightning specialist Ron Holle said in a WMO statement.

"Any time there is thunder heard, it is time to reach a lightning-safe place".

Previously accepted WMO 'lightning extremes' include a 1975 incident in which 21 people were killed by a single flash of a lightning as they huddled inside a tent in Zimbabwe, and modern events show how dangerous weather can also cut electricity for days, as with the Hong Kong typhoon outages that affected families.

In another incident, 469 people were killed when lightning struck the Egyptian town of Dronka in 1994, causing burning oil to flood the town, and major incidents can also disrupt infrastructure, as seen during the LA power outage following a substation fire.

The WMO notes that the only lightning-safe locations are "substantial" buildings with wiring and plumbing, and dedicated lightning protection training helps reinforce these guidelines, rather than structures such as bus stops or those found at beaches.

Fully enclosed metal-topped vehicles are also considered reliably safe, and regional storm safety tips offer additional guidance.


Related News

View more

Nunavut's electricity price hike explained

Nunavut electricity rate increase sees QEC raise domestic electricity rates 6.6% over two years, affecting customer rates, base rates, subsidies, and kWh overage charges across communities, with public housing exempt and territory-wide pricing denied.


Key Points

A 6.6% QEC hike over 2018-2019, affecting customer rates, subsidies, and kWh overage; public housing remains exempt.

✅ 3.3% on May 1, 2018; 3.3% on Apr 1, 2019

✅ Subsidy caps: 1,000 kWh Oct-Mar; 700 kWh Apr-Sep

✅ Territory-wide base rate denied; public housing exempt


Ahead of the Nunavut government's approval of the general rate increase for the Qulliq Energy Corporation, many Nunavummiut wondered how the change would impact their electricity bills.

QEC's request for a 6.6-per-cent increase was approved by the government last week. The increase will be spread out over two years, a pattern similar to BC Hydro's two-year rate plan, with the first increase (3.3 per cent) effective May 1, 2018. The remaining 3.3 per cent will be applied on April 1, 2019.

Public housing units, however, are exempt from the government's increase altogether.

The power corporation also asked for a territory-wide rate, so every community would pay the same base rate (we'll go over specific terms in a minute if you're not familiar with them). But that request was denied, even as Manitoba Hydro scaled back increases next year, and QEC will now take the next two years reassessing each community's base rate.

#google#

So, what does this mean for your home's power bill? Well, there's a few things you need to know, which we'll get to in a second.

But in essence, as long as you don't go over the government-subsidized monthly electricity usage limit, you're paying an extra 3.61 cents per kilowatt hour (kWh).

To be clear, we're talking about non-government domestic rates — basically, private homeowners — and those living in a government-owned unit but pay for their own power.


The basics

First, some quick terminology. The "base rate" term we're going to use (and used above) in this story refers to the community rate. As in, what QEC charges customers in every community. The "customer rate" is the rate customers actually pay, after the government's subsidy.


The first thing you need to know is everyone in Nunavut starts off by paying the same customer rate, unlike jurisdictions using a price cap to limit spikes.

That's because the government subsidizes electricity costs, and that subsidy is different in every community, because the base rate is different.

For example, Iqaluit's new base rate after the 3.3 per cent increase (remember, the 6.6 per cent is being applied over two years) is 56.69 cents per kWh, while Kugaaruk's base rate rose to 112.34 cents per kWh. Those, by the way, are the territory's lowest and highest respective base rates.

However, customers in both Iqaluit and Kugaaruk will each now pay 28.35 cents per kWh because, remember, the government subsidizes the base rates in every community.

Now, remember earlier we mentioned a "government-subsidized monthly electricity usage limit?" That's where customers in various communities start to pay different amounts.

As simply as we can explain it, the government will only cover so much electricity usage in a month, in every household.

Between October and March, the government will subsidize the first 1,000 kilowatt hours, and only 700 kilowatt hours from April to September. QEC says the average Nunavut home will use about 500 kilowatt hours every month over the course of a year.

But if your household goes over that limit, you're at the mercy of your community's base rate for any extra electricity you use. Homes in Kugaaruk in December, for instance, will have to pay that 122.34 cents for every extra kilowatt hour it uses, while homes in Iqaluit only have to pay 56.69 cents per kWh for its extra electricity.

That's where many Nunavummiut have criticized the current rate structure, because smaller communities are paying more for their extra costs than larger communities.

QEC had hoped — as it had asked for — to change the structure so every community pays the same base rate. So regardless of if people go over their electricity usage limits for the government subsidy, everyone would pay the same overage rates.

But the government denied that request.


New rate is actually lower

The one thing we should highlight, however, is the new rate after the increase is actually lower than what customers were paying in 2014.

For the past seven months, customers have been getting power from QEC at a discount, whereas Newfoundland customers began paying for Muskrat Falls during the same period, to different effect.

That's because when QEC sets its rates, it does so based on global oil price forecasts. Since 2014, the price of oil worldwide has slumped, and so QEC was able to purchase it at less than it had anticipated.

When that happens, and QEC makes more than $1 million within a six month period thanks to the lower oil prices, it refunds the excess profits back to customers through a discount on electricity base rates — a mechanism similar to a lump-sum credit used elsewhere — the government subsidy, however, doesn't change so the savings are passed on directly to customers.

Now, the 6.6 per cent increase to electricity rates, is actually being applied to the discounted base rate from the last seven months.

So again, while customers are paying more than they have been for the last seven months, it's lower than what they were paying in 2014.

Lastly, to be clear, all the figures used in this story are only for domestic non-government rates. Commercial rates and changes have not been explored in this story, given the differences in subsidy and rate application.


Related News

View more

Cal ISO Warns Rolling Blackouts Possible, Calls For Conservation As Power Grid Strains

Cal ISO Flex Alert urges Southern California energy conservation as a Stage 2 emergency strains the power grid, with potential rolling blackouts during peak hours from 3 to 10 p.m., if demand exceeds supply.


Key Points

A statewide call to conserve power during high demand, issued by the grid operator to prevent rolling blackouts.

✅ Stage 2 emergency signals severe grid strain

✅ Peak Flex Alert hours: 3 to 10 p.m. statewide

✅ Set thermostats to 78 and avoid major appliances


Residents and businesses across Southern California were urged to conserve power Tuesday afternoon amid ongoing electricity inequities across the state as the manager of the state’s power grid warned rolling blackouts could be imminent for some power customers.

The California Independent System Operator (Cal ISO), which manages the state power grid, declared a Stage 2 emergency as of 2:30 p.m., indicating severe strain on the electrical system, similar to a recent grid alert in Alberta that relied on reserves.

ADVERTISING

Rolling blackouts for some customers could occur in a Stage 3 emergency, distinct from the intentional shut-offs some utilities use to reduce wildfire risk.

Cal ISO issued a statewide Flex Alert in effect from 3 to 10 p.m. Tuesday and Wednesday, with conservation considered especially critical during those hours, a concern heightened by pandemic-era grid operations this year.

Officials told reporters rolling blackouts might be avoided Tuesday evening if residents repeat the level of conservation seen Monday.
“If we can get the same sort of response we got yesterday, we can minimize this, or perhaps avoid it altogether,” Cal-ISO President/CEO Steve Berberich said, noting that some operators have even planned staff lockdowns during COVID-19 to maintain reliability.

Cal-ISO controls roughly 80% of the state’s power grid through Southern California Edison, Pacific Gas and Electric Co., with the utility recently restoring power after shut-offs in affected communities, and San Diego Gas & Electric.

Residents are urged to set thermostats at 78 in the afternoon and evening hours and avoiding the use of air conditioning and major appliances during the Flex Alert hours, as utilities like PG&E prepare for winter storms to improve resilience.


Related News

View more

Sign Up for Electricity Forum’s Newsletter

Stay informed with our FREE Newsletter — get the latest news, breakthrough technologies, and expert insights, delivered straight to your inbox.

Electricity Today T&D Magazine Subscribe for FREE

Stay informed with the latest T&D policies and technologies.
  • Timely insights from industry experts
  • Practical solutions T&D engineers
  • Free access to every issue

Download the 2025 Electrical Training Catalog

Explore 50+ live, expert-led electrical training courses –

  • Interactive
  • Flexible
  • CEU-cerified