Substation Relay Protection Training
Our customized live online or in‑person group training can be delivered to your staff at your location.

- Live Online
- 12 hours Instructor-led
- Group Training Available
Regular Price:
$699
Coupon Price:
$599
VANCOUVER
—
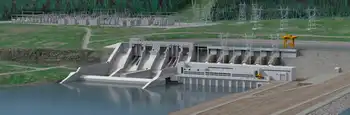
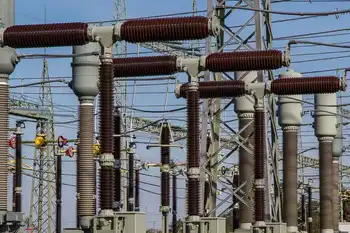
Site C 500 kV transmission lines strengthen the BC Hydro grid, linking the new substation and Peace Canyon via a 75 kilometre right-of-way to deliver clean energy, with 400 towers built and both circuits energized.
Key Information
High-voltage lines connecting Site C substation to the BC Hydro grid, delivering clean energy via Peace Canyon.
75 km right-of-way between Site C substation and Peace Canyon
Second and final 500 kV line completed and energized
Over 400 towers constructed and lines strung since 2018
Contract awarded to Allteck in 2018 for construction
Three 1 km 500 kV links to substation due in 2023
The second and final 500 kilovolt, 75 kilometre transmission line on the Site C project, which has faced stability questions in recent years, has been completed and energized.
With this milestone, the work to connect the new Site C substation to the BC Hydro grid, amid treaty rights litigation that has at times shaped schedules, is complete. Once the Site C project begins generating electricity, much like when the Maritime Link first power flowed between Newfoundland and Nova Scotia, the transmission lines will help deliver clean energy to the rest of the province.
The two 75 kilometre transmission lines run along an existing right-of-way between Site C and the Peace Canyon generating station, a route that has seen community concerns from some northerners. The project’s first 500 kilovolt, 75 kilometre transmission line – along with the Site C substation – were both completed and energized in the fall of 2020.
BC Hydro awarded the Site C transmission line construction contract to Allteck Line Contractors Inc. (now Allteck Limited Partnership) in 2018. Since construction started on this part of the project in summer 2018, crews have built more than 400 towers and strung lines, even as other interties like the Manitoba-Minnesota line have faced scheduling uncertainty, over a total of 150 kilometres.
The two transmission lines are a major component of the Site C project, comparable to initiatives such as the New England Clean Power Link in scale, which also consists of the new 500 kilovolt substation and expanding the existing Peace Canyon 500 kilovolt gas-insulated switchgear to incorporate the two new 500 kilovolt transmission line terminals.
Work to complete three other 500 kilovolt transmission lines that will span one kilometre between the Site C generating station and Site C substation, similar to milestones on the Maritime Link project, is still underway. This work is expected to be complete in 2023.
Related News
Related News
Alberta Advances Electricity Plans with Rate of Last Resort
Alberta Rate of Last Resort provides a baseline electricity price, boosting energy reliability, affordability, and…
View more
India's Solar Growth Slows with Surge in Coal Generation
India Solar Slowdown and Coal Surge highlights policy uncertainty, grid stability concerns, financing gaps, and…
View more
U.S. Residents Averaged Fewer Power Outages in 2022
2022 U.S. Power Outage Statistics show lower SAIDI as fewer major events hit, with SAIFI…
View more
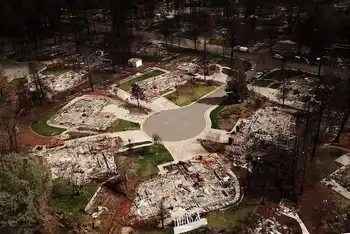
PG&E pleads guilty to 85 counts in 2018 Camp Fire
PG&E Camp Fire Guilty Plea underscores involuntary manslaughter charges as the utility admits sparking Paradise's…
View more
Hydro One announces pandemic relief fund for Hydro One customers
Hydro One Pandemic Relief Fund offers COVID-19 financial assistance, payment flexibility, and Winter Relief to…
View more
Neo-Nazi, woman accused of plotting 'hate-fueled attacks' on power stations, federal complaint says
Baltimore Substation Attack Plot highlights alleged neo-Nazi plans targeting electrical substations and the power grid,…
View more
Sign Up for Electricity Forum’s Newsletter
Stay informed with our FREE Newsletter — get the latest news, breakthrough technologies, and expert insights, delivered straight to your inbox.
Electricity Today T&D Magazine Subscribe for FREE

Stay informed with the latest T&D policies and technologies.
- Timely insights from industry experts
- Practical solutions T&D engineers
- Free access to every issue

