NFPA 70E Training
Our customized live online or in‑person group training can be delivered to your staff at your location.

- Live Online
- 6 hours Instructor-led
- Group Training Available
Regular Price:
$199
Coupon Price:
$149
REGINA
—
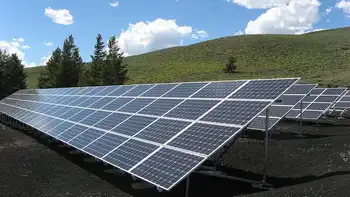
Saskatchewan Solar Net Metering Program lets rooftop solar users offset at retail rate while earning 7.5 cents/kWh credits for excess energy; rebates are removed, SaskPower balances grid costs with a 100 kW cap.
Story Summary
An updated SaskPower plan crediting rooftop solar at 7.5 cents/kWh, offsetting usage at retail rate, without rebates.
Excess energy credited at 7.5 cents/kWh
Offsets on-site use at retail electricity rates
Up to 100 kW generation; no program capacity cap
Saskatchewan has unveiled a new program that credits electricity customers for generating their own solar power, but it won’t pay as much as an older program did or reimburse them with rebates for their costs to buy and install equipment.
The new net metering program takes effect Nov. 1, and customers will be able to use solar to offset their own power use at the retail rate, similar to UK households' right to sell power in comparable schemes, though program details differ.
But they will only get 7.5 cents per kilowatt hour credit on their bills for excess energy they put back into the grid, as seen in Duke Energy payment changes in other jurisdictions, rather than the 14 cents in the previous program.
Dustin Duncan, the minister responsible for Crown-owned SaskPower, says the utility had to consider the interests of people wanting to use rooftop solar and everyone else who doesn’t have or can’t afford the panels, who he says would have to make up for the lost revenue.
Duncan says the idea is to create a green energy option, with wind power gains highlighting broader competitiveness, while also avoiding passing on more of the cost of the system to people who just cannot afford solar panels of their own.
Customers with solar panels will be allowed to generate up to 100 kilowatts of power against their bills.
“It’s certainly my hope that this is going to provide sustainability for the industry, as illustrated by Alberta's renewable surge creating jobs, that they have a program that they can take forward to their potential customers, while at the same time ensuring that we’re not passing onto customers that don’t have solar panels more cost to upkeep the grid,” Duncan said Tuesday.
Saskatchewan NDP leader Ryan Meili said he believes eliminating the rebate and cutting the excess power credit will kill the province’s solar energy, a concern consistent with lagging solar demand in Canada in recent national reports, he said.
“(Duncan) essentially made it so that any homeowner who wants to put up panels would take up to twice as long to pay it back, which effectively prices everybody in the small part of the solar production industry — the homeowners, the farms, the small businesses, the small towns — out of the market,” Meili said.
The province’s old net metering program hit its 16 megawatt capacity ahead of schedule, forcing the program to shut down, while disputes like the Manitoba Hydro solar lawsuit have raised questions about program management elsewhere. It also had a rebate of 20 per cent of the cost of the system, but that rebate has been discontinued.
The new net metering program won’t have any limit on program capacity, or an end date.
According to Duncan, the old program would have had a net negative impact to SaskPower of about $54 million by 2025, but this program will be much less — between $4 million and $5 million.
Duncan said other provinces either have already or are in the process of moving away from rebates for solar equipment, including Nova Scotia's proposed solar charge and similar reforms, and away from the one-to-one credits for power generation.
Related News
Related News
Tube Strikes Disrupt London Economy
London Tube Strikes Economic Impact highlights transport disruption reducing foot traffic, commuter flows, and tourism,…
View more
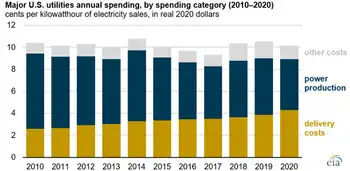
Major U.S. utilities spending more on electricity delivery, less on power production
U.S. Utility Spending Shift highlights rising transmission and distribution costs, grid modernization, and smart meters,…
View more
EU outlines $300 billion plan to dump Russian energy
REPowerEU Plan accelerates the EU's shift from Russian fossil fuels with renewable energy, energy efficiency,…
View more
Turning thermal energy into electricity
Near-Field Thermophotovoltaics captures radiated energy across a nanoscale gap, using thin-film photovoltaic cells and indium…
View more
Europe's Thirst for Electricity Spurs Nordic Grid Blockade
Nordic Power Grid Dispute highlights cross-border interconnector congestion, curtailed exports and imports, hydropower priorities, winter…
View more

Europe's Worst Energy Nightmare Is Becoming Reality
European Energy Crisis shocks markets as Russia slashes gas via Nord Stream, spiking prices and…
View more
Sign Up for Electricity Forum’s Newsletter
Stay informed with our FREE Newsletter — get the latest news, breakthrough technologies, and expert insights, delivered straight to your inbox.
Electricity Today T&D Magazine Subscribe for FREE

Stay informed with the latest T&D policies and technologies.
- Timely insights from industry experts
- Practical solutions T&D engineers
- Free access to every issue
