Substation Relay Protection Training
Our customized live online or in‑person group training can be delivered to your staff at your location.

- Live Online
- 12 hours Instructor-led
- Group Training Available
Regular Price:
$699
Coupon Price:
$599
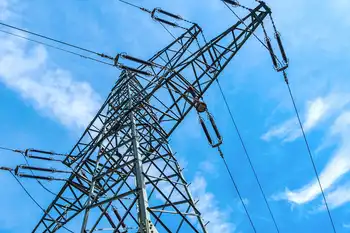
SaskPower Northern Transmission Line will meet rising electricity demand in Saskatchewan, improve grid reliability, and support infrastructure growth, with 230-kV capacity, clearing near Lindsay Lake and Key Lake, safety measures, and northern crews.
The Big Picture
A 230-kV transmission project in northern Saskatchewan to meet demand, improve reliability, and renew grid assets.
- 230-kV line to boost capacity and reliability
- Serves growing demand in northern Saskatchewan
- Clearing from Lindsay Lake to Key Lake through Dec 2012
- In-service target: Q4 2014
- Approximately 275 northern workers engaged
SaskPower and Kitsaki Management Limited Partnership have resumed clearing trees and brush in northern Saskatchewan to make way for a high-voltage transmission line north of Sandy Bay.
The new line is needed to accommodate increased electricity demand in the northern region of Saskatchewan and will improve service reliability, as seen in recent storm repairs by SaskPower in the North.
"Saskatchewan is growing at a tremendous pace and the demand for electricity in the province has nearly doubled over historical norms,” said SaskPower President and CEO Robert Watson. “This new power line in the North will help ensure that SaskPower supports that growth through a multi-year investment into renewing our infrastructure."
"We are very pleased to see nearly 275 northern people have the opportunity to work on this clearing project,” said Russell Roberts, Kitsaki CEO. "We’ve worked closely with SaskPower to position crew campsites no further than four kilometres apart on the right-of-way, similar to the Kenora corridor upgrade approach, to allow for safe and quick access to and from camps during the work period."
Crews are now working in the area from Lindsay Lake to Key Lake. This work involves the use of heavy equipment, like during transmission line construction in BC, and the falling of large trees. For the safety of crews and members of the general public, non-workers are asked to stay away from this area while clearing is taking place. There will be increased highway and road traffic in and around the Lindsay Lake and Key Lake areas as workers arrive and equipment and supplies are delivered.
Fall clearing is expected to be completed by late December 2012. The planned in-service date for the new 230-kilovolt transmission line is, as with the Dry Fork grid link project, the fourth quarter of 2014.
SaskPower maintains and operates more than 152,000 km of power lines in Saskatchewan. With a rapidly developing economy and the second largest service area in Canada, renewing and replacing transmission and distribution infrastructure, including projects like a new line in the Okanagan, is a corporate priority.
Related News
Related News

New Orleans Levees Withstood Hurricane Ida as Electricity Failed
Hurricane Ida New Orleans Infrastructure faced a split outcome: levees and pumps protected against storm…
View more

Shell’s strategic move into electricity
Shell's Industrial Electricity Supply Strategy targets UK and US industrial customers, leveraging gas-to-power, renewables, long-term…
View more

Scottish Wind Delivers Equivalent Of 98% Of Country’s October Electricity Demand
Scotland Wind Energy October saw renewables supply the equivalent of 98 percent of electricity demand,…
View more

94,000 lose electricity in LA area after fire at station
Los Angeles Power Station Fire prompts LADWP to shut a Northridge/Reseda substation, causing a San…
View more

Why the promise of nuclear fusion is no longer a pipe dream
ITER Nuclear Fusion advances tokamak magnetic confinement, heating deuterium-tritium plasma with superconducting magnets, targeting net…
View more
Putting Africa on the path to universal electricity access
West and Central Africa Electricity Access hinges on utility reform, renewable energy, off-grid solar, mini-grids,…
View more
Sign Up for Electricity Forum’s Newsletter
Stay informed with our FREE Newsletter — get the latest news, breakthrough technologies, and expert insights, delivered straight to your inbox.
Electricity Today T&D Magazine Subscribe for FREE

Stay informed with the latest T&D policies and technologies.
- Timely insights from industry experts
- Practical solutions T&D engineers
- Free access to every issue

