
Electrical Commissioning In Industrial Power Systems
Our customized live online or in‑person group training can be delivered to your staff at your location.

- Live Online
- 12 hours Instructor-led
- Group Training Available
Regular Price:
$599
Coupon Price:
$499
SEATTLE
—
Seattle City Light Energy Efficiency Programs help 93,000 residents cut bills with rebates, home energy audits, weatherization, conservation workshops, and sustainability tools, reducing electricity use and greenhouse gas emissions across Seattle communities.
What You Need to Know
They are utility programs that lower electricity use and bills via rebates, energy audits, and weatherization services.
Rebates for efficient appliances reduce kWh use and costs.
Free home energy audits identify prioritized upgrades.
Weatherization assistance supports low-income households.
Assisted 93,000+ customers; lowers bills and emissions.
In a noteworthy achievement for both residents and the environment, Seattle City Light has successfully helped more than 93,000 customers reduce their electricity bills through various energy efficiency programs. This initiative not only alleviates financial burdens for many households, amid concerns about pandemic-era shut-offs that heightened energy insecurity, but also aligns with the city’s commitment to sustainability and responsible energy use.
The Drive for Energy Efficiency
Seattle City Light, the city’s publicly owned electric utility, has been at the forefront of promoting energy efficiency among its customers. Recognizing that energy costs can strain household budgets, the utility has developed a range of programs and tracks emerging utility rate designs to help residents lower their energy consumption and, consequently, their bills.
One of the main aspects of this initiative is the emphasis on education and awareness. By providing customers with tools and resources to understand their energy usage, City Light empowers residents to make informed choices that can lead to substantial savings and prepare for power outage events as well.
Key Programs and Services
Seattle City Light offers a variety of programs aimed at reducing energy consumption. Among the most popular are:
-
Energy Efficiency Rebates: Customers can receive rebates for purchasing energy-efficient appliances, such as refrigerators, washing machines, and HVAC systems. These appliances are designed to consume less electricity than traditional models, resulting in lower energy bills over time.
-
Home Energy Audits: Free energy audits are available for residential customers. During these audits, trained professionals assess homes for energy efficiency and provide recommendations on improvements. This personalized service allows homeowners to understand specific changes that can lead to savings.
-
Weatherization Assistance: This program is particularly beneficial for low-income households. By improving insulation, sealing air leaks, and enhancing overall energy efficiency, residents can maintain comfortable indoor temperatures without over-relying on heating and cooling systems.
-
Community Workshops: Seattle City Light conducts workshops that educate residents about energy conservation strategies. These sessions cover topics such as smart energy use, seasonal tips for reducing consumption, and the benefits of renewable energy sources, highlighting examples of clean energy engagement in other cities.
The Impact on Households
The impact of these initiatives is profound. By assisting over 93,000 customers in lowering their electricity bills, Seattle City Light not only provides immediate financial relief but also encourages a long-term commitment to energy conservation. This collective effort has resulted in significant reductions in overall energy consumption, contributing to a decrease in greenhouse gas emissions—a critical step in the fight against climate change.
Additionally, the programs have been particularly beneficial for low-income households. By targeting these communities, Seattle City Light ensures that the benefits of energy efficiency reach those who need them the most, promoting equity-focused regulation and access to essential resources.
Looking Ahead: Challenges and Opportunities
While the success of these initiatives is commendable, challenges remain. Fluctuating energy prices can still pose difficulties for many households, especially those on fixed incomes, as some utilities explore minimum charges for low-usage customers in their rate structures. Seattle City Light recognizes the need for ongoing support and resources to help residents navigate these financial challenges.
The utility is committed to expanding its programs to reach even more customers in the future. This includes enhancing outreach efforts to ensure that residents are aware of the available resources, even as debates like utility revenue in a free-electricity future shape planning, and potentially forming partnerships with local organizations to broaden the impact of its initiatives.
Related News
Related News

Shell’s strategic move into electricity
Shell's Industrial Electricity Supply Strategy targets UK and US industrial customers, leveraging gas-to-power, renewables, long-term…
View more

Told "no" 37 times, this Indigenous-owned company brought electricity to James Bay anyway
Five Nations Energy Transmission Line connects remote First Nations to the Ontario power grid, delivering…
View more
Heatwave Sparks Unprecedented Electricity Demand Across Eastern U.S
Eastern U.S. Heatwave Electricity Demand surges to record peak load, straining the power grid, lifting…
View more
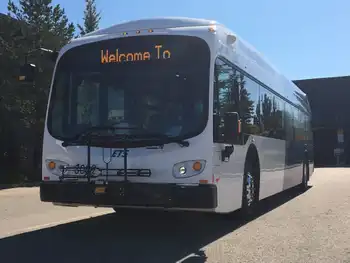
Edmonton's 1st electric bus hits city streets
Edmonton Electric Buses usher in zero-emission public transit with Proterra battery-electric vehicles, 350 km range,…
View more
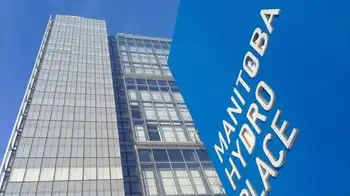
Pandemic causes drop in electricity demand across the province: Manitoba Hydro
Manitoba Electricity Demand Drop reflects COVID-19 effects, lowering peak demand about 6% as businesses and…
View more

Sens. Wyden, Merkley Introduce Bill to Ensure More Wildfire Resilient Power Grid
Wildfire Resilient Power Grid Act proposes DOE grants for utility companies to fund wildfire mitigation,…
View more
Sign Up for Electricity Forum’s Newsletter
Stay informed with our FREE Newsletter — get the latest news, breakthrough technologies, and expert insights, delivered straight to your inbox.
Electricity Today T&D Magazine Subscribe for FREE

Stay informed with the latest T&D policies and technologies.
- Timely insights from industry experts
- Practical solutions T&D engineers
- Free access to every issue

