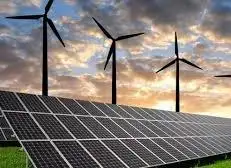
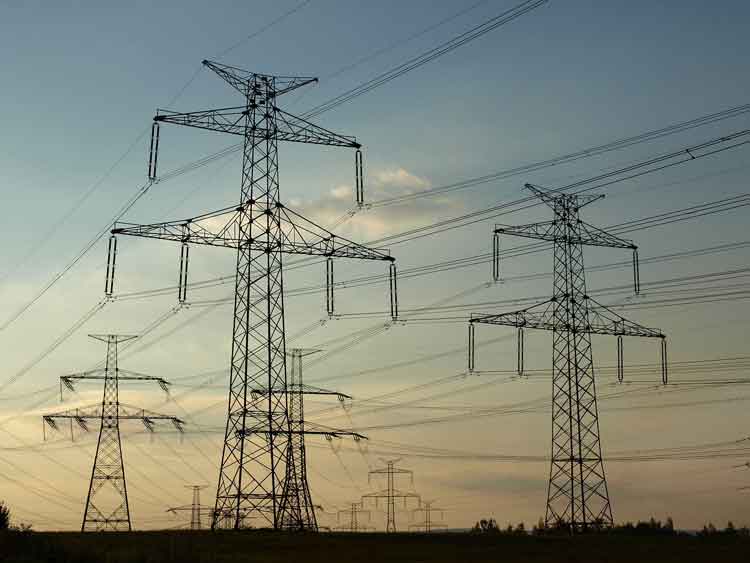
Here are 3 ways to find out where your electricity comes from

High Voltage Maintenance Training Online

Our customized live online or in‑person group training can be delivered to your staff at your location.

  • Live Online
  • 12 hours Instructor-led
  • Group Training Available
Regular Price:
$599
Coupon Price:
$499
Reserve Your Seat Today

US energy mix shows how the electric grid blends renewables, fossil fuels, nuclear, and hydro, varying by ISO/RTO markets, utilities, and state policies, affecting carbon emissions, pricing, reliability, and access.


Key Points

The US energy mix is the grid's source breakdown by region: fossil fuels, renewables, nuclear, and hydro.

✅ Check ISO or RTO dashboards for real-time generation by fuel source.

✅ Utilities may offer green power plans or RECs at modest premiums.

✅ Energy mix shifts with policy, pricing, and grid reliability needs.


There are few resources more important than energy. Sure, you may die if you don't eat for days. But your phone will die if you go too long without charging it. Energy feeds tech, the internet, city infrastructure, refrigerators, lights, and has evolved throughout U.S. history in profound ways. You get the idea. Yet unlike our other common needs, such as food, energy sources aren't exactly front of mind for most people. 

"I think a lot of people don't put a lot of bandwidth into thinking about this part of their lives," said Richard McMahon, the SVP of energy supply and finance at Edison Electric Institute, a trade group that represents investor-owned electric companies in the US. 

It makes sense. For most Americans, electricity is always there, and in many locations, there's not much of a choice involved, even as electricity demand is flat across the U.S. today. You sign up with a utility when you move into a new residence and pay your bills when they're due. 

But there's an important reality that indifference eschews: In 2018, a third of the energy-related carbon-dioxide emissions in the US came from the electric power sector, according to the US Energy Information Administration (EIA). 

A good chunk of that is from the residential sector, which consistently uses more energy than commercial customers, per EIA data.

Just as many people exercise choice when they eat, you typically also have a choice when it comes to your energy supply. That's not to say your current offering isn't what you want, or that switching will be easy or affordable, but "if you're a customer and want power with a certain attribute," McMahon said, "you can pretty much get it wherever you are." 

But first, you need to know the energy mix you have right now. As it turns out, it's not so straightforward. At all.

This brief guide may help. 

For some utility providers, you can find out if it publishes the energy mix online. Dominion Energy, which serves Idaho, North Carolina, Ohio, South Carolina, Utah, Virginia, West Virginia, and Wyoming, provides this information in a colored graphic. 

"Once you figure out who your utility is you can figure out what mix of resources they use," said Heidi Ratz, an electricity markets researcher at the World Resources Institute.

But not all utilities publish this information.

It has to do with their role in the grid and reflects utility industry trends in structure and markets. Some utility companies are vertically integrated; they generate power through nuclear plants or wind farms and distribute those electrons directly to their customers. Other utilities just distribute the power that different companies produce. 

Consider Consolidated Edison, or Con Ed, which distributes energy to parts of New York City. While reporting this story, Business Insider could not find information about the utility's energy mix online. When reached for comment, a spokesperson said, "we're indifferent to where it comes from."

That's because, in New York, distribution utilities like Con Ed often buy energy through a wholesale marketplace.

Take a look at this map. If you live in one of the colored regions, your electricity is sold on a wholesale market regulated by an organization called a regional transmission organization (RTO) or independent system operator (ISO). Distribution utilities like Con Ed often buy their energy through these markets, based on availability and cost, while raising questions about future utility revenue models as prices shift. 

Still, it's pretty easy to figure out where your energy comes from. Just look up the ISO or RTO website (such as NYISO or CAISO). Usually, these organizations will provide energy supply information in near-real time. 

That's exactly what Con Edison (which buys energy on the NYISO marketplace) suggested. As of Friday morning, roughly 40% of the energy on the market place was natural gas or other fossil fuels, 34% was nuclear, and about 22% was hydro. 

If you live in another region governed by an ISO or RTO, such as in most of California, you can do the same thing. Like NYISO, CAISO has a dashboard that shows (again, as of Friday morning) about 36% of the energy on the market comes from natural gas and more than 20% comes from renewables. 

In the map linked above, you'll notice that some of the ISOs and RTOs like MISO encompass enormous regions. That means that even if you figure out where the energy in your market comes from, it's not going to be geographically specific. But there are a couple of ways to drill down even further. 

The Environmental Protection Agency has a straightforward tool called Power Profiler. You can enter your zip code to see the fuel mix in your area. But it's not perfect. The data are from 2016 and, in some regions of the country like the upper Midwest, they aren't much more localized, and some import dirty electricity due to regional trading. 

The World Resources Institute also has a tool that allows you to see the electricity mix by state, based on 2017 data from EIA. These numbers represent power generation, not the electricity actually flowing into your sockets, but they offer a rough idea of what energy resources are operating in your state. 

One option is to check with your utility to see if it has a "green power" offering. Over 600 utilities across the country have one, according to the Climate Reality Project, though they often come at a slightly higher cost. It's typically on the scale of just a few more cents per kilowatt-hour. 

There are also independent, consumer-facing companies like Arcadia and Green Mountain Energy that allow you to source renewable energy, by virtually connecting you to community solar projects or purchasing Renewable Energy Certificates, or RECs, on your behalf, as America goes electric and more options emerge. 

"RECs measure an investment in a clean energy resource," Ratz said, in an email. "The goal of putting that resource on the grid is to push out the need for dirtier resources."

The good news: Even if you do nothing, your energy mix will get cleaner. Coal production has fallen to lows not seen since the 1980s, amid disruptions in coal and nuclear sectors that affect reliability and costs, while renewable electricity generation has doubled since 2008. So whether you like it or not, you'll be roped into the clean energy boom one way or another. 


Related News

Related News

PG&E Wildfire Assistance Program Accepting Applications for Aid

PG&E Wildfire Assistance Program offers court-approved aid and emergency grants for Northern California wildfires and Camp Fire victims, covering unmet needs, housing, and essentials; apply online by November 15, 2019 under Chapter 11-funded eligibility.


Key Points

A $105M, court-approved aid fund offering unmet-needs payments and emergency support for 2017-2018 wildfire victims.

✅ $5,000 Basic Unmet Needs per household, self-certified

✅ Supplemental aid for extreme circumstances after basic grants

✅ Apply online; deadline November 15, 2019; identity required


Beginning today, August 15, 2019, those displaced by the 2017 Northern California wildfires and 2018 Camp fire can apply for aid through an independently administered Wildfire Assistance Program funded by Pacific Gas and Electric Company (PG&E). PG&E’s $105 million fund, approved by the judge in PG&E’s Chapter 11 cases and related bankruptcy plan, is intended to help those who are either uninsured or need assistance with alternative living expenses or other urgent needs. The court-approved independent administrator is set to file the eligibility criteria as required by the court and will open the application process.

“Our goal is to get the money to those who most need it as quickly as possible. We will prioritize wildfire victims who have urgent needs, including those who are currently without adequate shelter,” said Cathy Yanni, plan administrator. Yanni is partnering with local agencies and community organizations to administer the fund, and PG&E also supports local communities through property tax contributions to counties.

“We appreciate the diligent work of the fund administrator in quickly establishing a way to distribute these funds and ensuring the program supports those with the most immediate needs. PG&E is focused on helping those impacted by the devastating wildfires in recent years and strengthening our energy system to reduce wildfire risks and prevent utility-caused catastrophic fires. We feel strongly that helping these communities now is the right thing to do,” said Bill Johnson, CEO and President of PG&E Corporation.

Applicants can request a “Basic Unmet Needs” payment of $5,000 per household for victims who establish basic eligibility requirements and self-certify that they have at least $5,000 of unmet needs that have not been compensated by the Federal Emergency Management Agency (FEMA). Payments are to support needs such as water, food, prescriptions, medical supplies and equipment, infant formula and diapers, personal hygiene items, and transportation fuels beyond what FEMA covered in the days immediately following the declared disasters, aligning with broader health and safety actions the company has taken.

Those who receive basic payments may also qualify for a “Supplemental Unmet Needs” payment. These funds will be available only after “Basic Unmet Needs” payments have been issued. Supplemental payments will be available to individuals and families who currently face extreme or extraordinary circumstances as compared to others who were impacted by the 2017 and 2018 wildfires, including areas affected by power line-related fires across California.

To qualify for the payments, applicants’ primary residence must have been within the boundary of the 2017 Northern California wildfires or the 2018 Camp fire in Butte County. Applicants also must establish proof of identity and certify that they are not requesting payments for an expense already paid for by FEMA.

Applicants can find more information and apply for assistance at https://www.norcalwildfireassistanceprogram.com/. The deadline to file for aid is November 15, 2019.

The $105 million being provided by PG&E was made available from the company’s cash reserves. PG&E will not seek cost recovery from its customers, and its rates are set to stabilize in 2025 according to recent guidance.


Related News

View more

COVID-19: Daily electricity demand dips 15% globally, says report

COVID-19 Impact on Electricity Demand, per IEA data, shows 15% global load drop from lockdowns, with residential use up, industrial and service sectors down; fossil fuel generation fell as renewables and photovoltaics gained share.


Key Points

An overview of how lockdowns cut global power demand, boosted residential use, and increased the renewable share.

✅ IEA review shows at least 15% dip in daily global electricity load

✅ Lockdowns cut commercial and industrial demand; homes used more

✅ Fossil fuels fell as renewables and PV generation gained share


The daily demand for electricity dipped at least 15 per cent across the globe, according to Global Energy Review 2020: The impacts of the COVID-19 crisis on global energy demand and CO2 emissions, a report published by the International Energy Agency (IEA) in April 2020, even as global power demand surged above pre-pandemic levels.

The report collated data from 30 countries, including India and China, that showed partial and full lockdown measures adopted by them were responsible for this decrease.

Full lockdowns in countries — including France, Italy, India, Spain, the United Kingdom where daily demand fell about 10% and the midwest region of the United States (US) — reduced this demand for electricity.


Reduction in electricity demand after lockdown measures (weather corrected)


Source: Global Energy Review 2020: The impacts of the COVID-19 crisis on global energy demand and CO2 emissions, IEA


Drivers of the fall

There was, however, a spike in residential demand for electricity as a result of people staying and working from home. This increase in residential demand, though, was not enough to compensate for reduced demand from industrial and commercial operations.

The extent of reduction depended not only on the duration and stringency of the lockdown, but also on the nature of the economy of the countries — predominantly service- or industry-based — the IEA report said.

A higher decline in electricity demand was noted in countries where the service sector — including retail, hospitality, education, tourism — was dominant, compared to countries that had industrial economies.

The US, for example — where industry forms only 20 per cent of the economy — saw larger reductions in electricity demand, compared to China, where power demand dropped as the industry accounts for more than 60 per cent of the economy.

Italy — the worst-affected country from COVID-19 — saw a decline greater than 25 per cent when compared to figures from last year, even as power demand held firm in parts of Europe during later lockdowns.

The report said the shutting down of the hospitality and tourism sectors in the country — major components of the Italian economy — were said to have had a higher impact, than any other factor, for this fall.


Reduced fossil fuel dependency

Almost all of the reduction in demand was reportedly because of the shutting down of fossil fuel-based power generation, according to the report. Instead, the share of electricity supply from renewables in the entire portfolio of energy sources, increased during the pandemic, reflecting low-carbon electricity lessons observed during COVID-19.

This was due to a natural increase in wind and photovoltaic power generation compared to 2019 along with a drop in overall electricity demand that forced electricity producers from non-renewable sources to decrease their supplies, before surging electricity demand began to strain power systems worldwide.

The Power System Operation Corporation of India also reported that electricity production from coal — India’s primary source of electricity — fell by 32.2 per cent to 1.91 billion units (kilowatt-hours) per day, in line with India's electricity demand decline reported during the pandemic, compared to the 2019 levels.


Related News

View more

Germany turns its back on nuclear for good despite Europe's energy crisis

Germany nuclear phase-out underscores a high-stakes energy transition, trading reactors for renewables, LNG imports, and grid resilience to secure supply, cut emissions, and navigate climate policy, public opinion shifts, and post-Ukraine supply shocks.


Key Points

Germany's nuclear phase-out retires reactors, shifting to renewables, LNG, and grid upgrades for low-carbon power.

✅ Last three reactors: Neckarwestheim, Isar 2, and Emsland closed

✅ Supply secured via LNG imports, renewables, and grid flexibility

✅ Policy accelerated post-Fukushima; debate renewed after Ukraine war


The German government is phasing out nuclear power despite the energy crisis. The country is pulling the plug on its last three reactors, betting it will succeed in its green transition without nuclear power.

On the banks of the Neckar River, not far from Stuttgart in south Germany, the white steam escaping from the nuclear power plant in Baden-Württemberg will soon be a memory.

The same applies further east for the Bavarian Isar 2 complex and the Emsland complex, at the other end of the country, not far from the Dutch border.

While many Western countries depend on nuclear power, Europe's largest economy is turning the page, even if a possible resurgence of nuclear energy is debated until the end.

Germany is implementing the decision to phase out nuclear power taken in 2002 and accelerated by Angela Merkel in 2011, after the Fukushima disaster.

Fukushima showed that "even in a high-tech country like Japan, the risks associated with nuclear energy cannot be controlled 100 per cent", the former chancellor justified at the time.

The announcement convinced public opinion in a country where the powerful anti-nuclear movement was initially fuelled by fears of a Cold War conflict, and then by accidents such as Chernobyl.

The invasion of Ukraine on 24 February 2022 brought everything into question. Deprived of Russian gas, the flow of which was essentially interrupted by Moscow, Germany found itself exposed to the worst possible scenarios, from the risk of its factories being shut down to the risk of being without heating in the middle of winter.

With just a few months to go before the initial deadline for closing the last three reactors on 31 December, the tide of public opinion began to turn, and talk of a U-turn on the nuclear phaseout grew louder. 

"With high energy prices and the burning issue of climate change, there were of course calls to extend the plants," says Jochen Winkler, mayor of Neckarwestheim, where the plant of the same name is in its final days.

Olaf Scholz's government, which the Green Party - the most hostile to nuclear power - is part of, finally decided to extend the operation of the reactors to secure the supply until 15 April.

"There might have been a new discussion if the winter had been more difficult if there had been power cuts and gas shortages nationwide. But we have had a winter without too many problems," thanks to the massive import of liquefied natural gas, notes Mr Winkler.


Related News

View more

Tariff Threats Boost Support for Canadian Energy Projects

Canadian Energy Infrastructure Tariffs are reshaping pipelines, deregulation, and energy independence, as U.S. trade tensions accelerate approvals for Alberta oil sands, Trans Mountain expansion, and CAPP proposals amid regulatory reform and market diversification.


Key Points

U.S. tariff threats drive approvals, infrastructure, and diversification to strengthen Canada energy security.

✅ Tariff risk boosts support for pipelines and export routes

✅ Faster project approvals and deregulation gain political backing

✅ Diversifying markets reduces reliance on U.S. buyers


In recent months, the Canadian energy sector has experienced a shift in public and political attitudes toward infrastructure projects, particularly those related to oil and gas production. This shift has been largely influenced by the threat of tariffs from the United States, as well as growing concerns about energy independence and U.S.-Canada trade tensions more broadly.

Scott Burrows, the CEO of Pembina Pipeline Corp., noted in a conference call that the potential for U.S. tariffs on Canadian energy imports has spurred a renewed sense of urgency and receptiveness toward energy infrastructure projects in Canada. With U.S. President Donald Trump’s proposed tariffs Trump tariff threat on Canadian imports, particularly a 10% tariff on energy products, there is increasing recognition within Canada that these projects are essential for the country’s long-term economic and energy security.

While the direct impact of the tariffs is not immediate, industry leaders are optimistic about the long-term benefits of deregulation and faster project approvals, even as some see Biden as better for Canada’s energy sector overall. Burrows highlighted that while it will take time for the full effects to materialize, there are significant "tailwinds" in favor of faster energy infrastructure development. This includes the possibility of more streamlined regulatory processes and a shift toward more efficient project timelines, which could significantly benefit the Canadian energy sector.

This changing landscape is particularly important for Alberta’s oil production, which is one of the largest contributors to Canada’s energy output. The Canadian Association of Petroleum Producers (CAPP) has responded to the growing tariff threat by releasing an “energy platform,” outlining recommendations for Ottawa to help mitigate the risks posed by the evolving trade situation. The platform includes calls for improved infrastructure, such as pipelines and transportation systems, and priorities like clean grids and batteries, to ensure that Canadian energy can reach global markets more effectively.

The tariff threat has also sparked a wider conversation about the need for Canada to strengthen its energy infrastructure and reduce its dependency on the U.S. for energy exports. With the potential for escalating trade tensions, there is a growing push for Canadian energy resources to be processed and utilized more domestically, though cutting Quebec’s energy exports during a tariff war. This has led to increased political support for projects like the Trans Mountain pipeline expansion, which aims to connect Alberta’s oil sands to new markets in Asia via the west coast.

However, the energy sector’s push for deregulation and quicker approvals has raised concerns among environmental groups and Indigenous communities. Critics argue that fast-tracking energy projects could lead to inadequate environmental assessments and greater risks to local ecosystems. These concerns underscore the tension between economic development and environmental protection in the energy sector.

Despite these concerns, there is a clear consensus that Canada’s energy industry needs to evolve to meet the challenges posed by shifting trade dynamics, even as polls show support for energy and mineral tariffs in the current dispute. The proposed U.S. tariffs have made it increasingly clear that the country’s energy infrastructure needs significant investment and modernization to ensure that Canada can maintain its status as a reliable and competitive energy supplier on the global stage.

As the deadline for the tariff decision approaches, and as Ford threatens to cut U.S. electricity exports, Canada’s energy sector is bracing for the potential fallout, while also preparing to capitalize on any opportunities that may arise from the changing trade environment. The next few months will be critical in determining how Canadian policymakers, businesses, and environmental groups navigate the complex intersection of energy, trade, and regulatory reform.

While the threat of U.S. tariffs may be unsettling, it is also serving as a catalyst for much-needed changes in Canada’s energy policy. The push for faster approvals and deregulation may help address some of the immediate concerns facing the sector, but it will be crucial for the government to balance economic interests with environmental and social considerations as the country moves forward in its energy transition.


Related News

View more

Energy prices trigger EU inflation, poor worst hit

EU Energy Price Surge is driving up electricity and gas costs, inflation, and cost of living across the EU, prompting tax cuts, price caps, subsidies, and household support measures in France, Italy, Spain, and Germany.


Key Points

A surge in EU gas and electricity costs driving inflation and prompting government subsidies, tax cuts, and price caps.

✅ Low-income EU households now spend 50-70 percent more on energy.

✅ Governments deploy tax cuts, price caps, and direct subsidies.

✅ Gas-dependent power markets drive electricity price spikes.


Higher energy prices, including for natural gas, are pushing up electricity prices and the cost of living for households across the EU, prompting governments to cut taxes and provide financial support to the tune of several billion euros.

In the United Kingdom, households are bracing for high winter energy bills this season.

A series of reports published by Cambridge Econometrics in October and November 2022 found that households in EU countries are spending much more on energy than in 2020 and that governments are spending billions of euros to help consumers pay bills and cut taxes.

In France, for example, the poorest households now spend roughly one-third more on energy than in 2020. Between August 2020 and August 2022, household energy prices increased by 37 percent, while overall inflation increased by 9.2 percent.

“We estimate that the increase in household energy prices make an average French household €410 worse off in 2022 compared to 2020, mostly due to higher gas prices,” said the report.

In response to rising energy prices, the French government has adopted price caps and support measures forecast to cost over €71 billion, equivalent to 2.9 percent of French GDP, according to the U.K.-based consultancy.

In Italy, fossil fuels alone were responsible for roughly 30 percent of the country’s annual rate of inflation during spring 2022, according to Cambridge Econometrics. Unlike in other European countries, retail electricity prices have outpaced other energy prices in Italy and were 112 percent higher in July 2022 than in August 2020, the report found. Over the same time period, retail petrol prices were up 14 percent, diesel up 22 percent, and natural gas up 42 percent.

We estimate that households in the lowest-income quintile now spend about 50 percent more on energy than in 2020.

“We estimate that before government support, an average Italian household will be spending around €1,400 more on energy and fuel bills this year than in 2020,” the report said. “Low-income households are worse affected by the increasing energy prices: we estimate that households in the lowest-income quintile now spend about 50 percent more on energy than in 2020.”

Electricity production in Italy is dominated by natural gas, which has also led to a spike in wholesale electricity prices. In 2010, natural gas accounted for 50 percent of all electricity production. The share of natural gas fell to 33 percent in 2014, but then rose again, reaching 48 percent in 2021, and 56 percent in the first half of 2022, according to the report, as gas filled the gap of record low hydro power production in 2022.

In Spain, where electricity prices have seen extreme spikes, low-income households are now spending an estimated 70% more on energy than in 2020, according to Cambridge Econometrics.


Low-income squeeze
In Spain, low-income households are now spending an estimated 70% more on energy than in 2020, according to Cambridge Econometrics. It noted that the Spanish government has intervened heavily in energy markets by cutting taxes, introducing cash transfers for households, and capping the price of natural gas for power generators. The latter has led to lower electricity prices than in many other EU countries.

These support measures are forecast to cost the Spanish government over €35 billion, equivalent to nearly 3 percent of Spain’s GDP. Yet consumers will still feel the burden of higher costs of living, and rolling back electricity prices may prove difficult in the near term.

In March, electricity prices alone were responsible for 45 percent of year-on-year inflation in Spain but prices have since fallen as a result of government intervention, Cambridge Econometrics said. Between May and July, fossil fuels prices accounted for 19-25 percent of the overall inflation rate, and electricity prices for 16 percent.


Support measures
Rising inflation is also a real challenge in Germany, Europe’s largest economy, where German power prices have surged this year, adding pressure. Also there, higher gas prices are to blame.

“We estimate that the increase in energy prices currently make an average household €735 worse off in 2022 compared to 2020, mostly due to higher gas prices,” Cambridge Econometrics said, in a report focused on Germany.

The German government has introduced a number of support measures in order to help households, businesses and industry to pay energy bills, amid rising heating and electricity costs for consumers, including price caps that are expected to take effect in March next year. Moreover, households’ energy bills for December this year will be paid by the state. According to the report, these interventions will mitigate the impact of higher prices “to some extent”, but the aid measures are forecast to cost the government nearly 5 percent of GDP.


Fossil-fuel effect
In addition to gas, higher coal prices have also pushed up inflation in some countries, and U.S. electricity prices have reached multi-decade highs as inflation endures.

In Poland, which is heavily dependent on coal for electricity generation, fossil fuels accounted for roughly 40 percent of Poland’s overall year-on-year inflation rate in June 2022, which stood at over 14 percent, the consultancy said.

The price of household coal, which is widely used in heating Polish homes, increased by 157 percent between August 2021 and August 2022.

Higher energy prices in Poland are partly due to Polish and EU sanctions against Russian gas and coal. Other drivers are the weakening of the Polish zloty against the U.S. dollar and the euro, and the uptick in global demand after COVID-19 lockdowns, said Cambridge Econometrics.

Electricity prices have risen at a much slower pace than energy for transport and heating, with an annualized increase of 5.1 percent.


Related News

View more

"It's freakishly cold": Deep freeze slams American energy sector

Texas Deep Freeze Energy Crisis strains grids as polar vortex triggers rolling blackouts, record natural gas and electricity prices, refinery shutdowns, WTI gains, and scarcity pricing across Texas, Oklahoma, SPP, and Mexico.


Key Points

A polar vortex slamming Texas energy: outages, record power prices, gas spikes, and reduced oil output.

✅ Record gas trades near $500/mmBtu; power hits $6,000/MWh

✅ WTI tops $60 as Texas shuts in ~1 million bpd

✅ Rolling blackouts across SPP; ERCOT scarcity pricing


A deep freeze is roiling electricity markets in more than a dozen U.S. states, leading to record-setting prices for electricity and natural gas, knocking oil production off line and shutting down some of North America’s largest refineries.

“It’s freakishly cold,” said Eric Fell, a senior natural gas analyst with Wood Mackenzie in Houston, where record cold temperatures and snow have blanketed the city, caused rolling power outages, shut down refineries and sent both natural gas and electricity prices soaring.

'It’s freakishly cold': Deep freeze slams North American energy sector

The polar vortex has led to freezing temperatures in every county in Texas, the largest energy-producing state in the U.S., and caused massive disruptions across the North American energy complex, triggering Texas power outages as far south as Mexico.

As the plunge in temperatures forced oil companies to shut in an estimated one million barrels of oil production in Texas on Monday, the West Texas Intermediate benchmark price rose above the US$60 per barrel threshold for the first time in a year to settle up 1 per cent, or US65 cents, at US$60.12 per barrel.

President Joe Biden declared an emergency on Monday, unlocking federal assistance to Texas.

People carry groceries from a local gas station on Monday in Austin, Texas. Winter storm Uri has brought historic cold weather to Texas, causing traffic delays and power outages. 

Frozen wind farms are just a small piece of Texas’s power grid woes right now.

Fell said regional natural gas and electricity prices in Oklahoma and Texas broke U.S. records over the weekend.

On Friday, Oklahoma gas transmission prices averaged US$350 per million British thermal units and Fell said one trade went as high as US$600 per mmBtu. In parts of the Texas panhandle and elsewhere, prices jumped to US$200, “all of which individually would have been new records,” Fell said, noting the previous record was US$160.

On Monday, natural gas for physical delivery in the U.S. was trading for as much as US$500 per mmBtu as demand for the heating and power plant fuel soared.  Spot gas has been trading for hundreds of dollars across the central U.S. since Thursday with a surge in heating demand triggering widespread blackouts and sending electricity prices soaring. The fuel normally trades in the region for less than US$3 per mmBtu.

Similarly, electricity prices in Texas surged to US$6,000 per megawatt hour on Monday, as U.S. power companies grapple with supply-chain constraints, which Fell said is “100 times the normal price.”

“You’re seeing scarcity pricing in power and gas. The only thing that’s different this time is it’s staying there – it’s not just an hour or two hours, it’s the whole day,” he said.

The blast of Arctic cold, which has blanketed Canada and much of the U.S., has created a massive draw on natural gas supplies, used both for home heating and industrial uses like electricity generation.

Little Rock, Ark.-based Southwest Power Pool, which coordinates electricity distribution for parts of 14 states including Oklahoma Kansas, Nebraska and even as far north as North Dakota, announced rolling blackouts across its network on Monday as a result of the power outages.

“In our history as a grid operator, this is an unprecedented event and marks the first time SPP has ever had to call for controlled interruptions of service” SPP’s executive vice-president and chief operating officer Lanny Nickell said in a release, adding the move was “a last resort” to “prevent circumstances from getting worse.”

The frigid conditions have led to a surge in natural gas prices across the continent, including in Alberta where the AECO benchmark price jumped to a seven-year high of $6.36 per thousand cubic feet last week, a price not seen since 2014.

Energy systems in Texas and Oklahoma, which are major energy exporters to other U.S. states, are built to withstand severe heat – not extreme cold. The result is a disruption to the gas supply at exactly the time the U.S. energy system is demanding those molecules.

“Given how far south it’s gone into Texas, this is where you have a lot of gas production that isn’t properly winterized,” said Jeremy McCrea, an analyst with Raymond James covering the natural gas industry.


Related News

View more

Sign Up for Electricity Forum’s Newsletter

Stay informed with our FREE Newsletter — get the latest news, breakthrough technologies, and expert insights, delivered straight to your inbox.

Electricity Today T&D Magazine Subscribe for FREE

Stay informed with the latest T&D policies and technologies.
  • Timely insights from industry experts
  • Practical solutions T&D engineers
  • Free access to every issue

Download the 2025 Electrical Training Catalog

Explore 50+ live, expert-led electrical training courses –

  • Interactive
  • Flexible
  • CEU-cerified