High Voltage Maintenance Training Online
Our customized live online or in‑person group training can be delivered to your staff at your location.

- Live Online
- 12 hours Instructor-led
- Group Training Available
Regular Price:
$599
Coupon Price:
$499
Aquila and Kansas City Power & Light fared well in a J.D. Power and Associates satisfaction survey for business customers of electric utilities. But Westar Energy was rated below average among Midwest utilities.
J.D. Power said the study was based on interviews with representatives of more than 13,500 U.S. businesses that spend between $500 and $50,000 monthly on electricity.
Overall customer satisfaction was measured based on power quality and reliability; customer service; company image; billing and payment; price; and communications. The ratings are translated to a point system, for which 1,000 would be a perfect score. In the Midwest, customers of 16 utilities were surveyed, and the average utility score was 686. Aquila scored 719, good for third place behind E.ON U.S. and MidAmerican Energy.
KCP&L was No. 7 with a 704 score, and Westar was next to last at 641.
Ameren which serves parts of eastern Missouri and Illinois, was last in the Midwest at 612. Nationwide, businesses served by the 58 largest U.S. electric utilities reported improvements in four of the six factors measured, with customer service and billing and payment factors registering the largest increases. Ratings for power quality and reliability and communications factors have also increased, but company image and price ratings were flat.
The national average score was 697, its highest ever, and continued a steady upward trend since 2004.
The area utilities fared differently last summer in J.D. Power's survey of general electric customers. Seventeen Midwest utilities were included in that survey, and KCP&L improved to fifth in that group. Westar ranked eighth and was the most improved utility in the study. But Aquila didn't do so well, ranking 16 out of 20 utilities in a separate category for medium-size utilities.
Related News
France Demonstrates the Role of Nuclear Power Plants
France Nuclear Power Strategy illustrates a low-carbon, reliable baseload complementing renewables in the energy transition,…
View more
Blood Nickel and Canada's Role in Global Mining Sustainability
Blood Nickel spotlights ethical sourcing in the EV supply chain, linking nickel mining to human…
View more

All-electric home sports big windows, small footprint
Cold-Climate Heat Pumps deliver efficient heating and cooling for Northern B.C. Net Zero Ready homes,…
View more
Rolls-Royce expecting UK approval for mini nuclear reactor by mid-2024
Rolls-Royce SMR UK Approval underscores nuclear innovation as regulators review a 470 MW factory-built modular…
View more
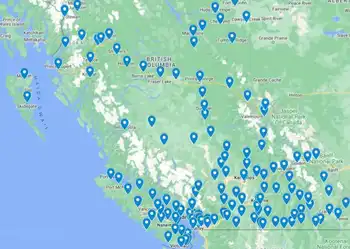
BC’s Electric Highway
British Columbia Electric Highway connects urban hubs and remote communities with 1,400+ EV charging stations,…
View more

Independent power project announced by B.C. Hydro now in limbo
Siwash Creek Hydroelectric Project faces downsizing under a BC Hydro power purchase agreement, with run-of-river…
View more
Sign Up for Electricity Forum’s Newsletter
Stay informed with our FREE Newsletter — get the latest news, breakthrough technologies, and expert insights, delivered straight to your inbox.
Electricity Today T&D Magazine Subscribe for FREE

Stay informed with the latest T&D policies and technologies.
- Timely insights from industry experts
- Practical solutions T&D engineers
- Free access to every issue
