
Substation Relay Protection Training
Our customized live online or in‑person group training can be delivered to your staff at your location.

- Live Online
- 12 hours Instructor-led
- Group Training Available
Regular Price:
$699
Coupon Price:
$599
WASHINGTON
—
Rate Design Initiative unites utilities, regulators, and advocates to craft innovative utility rate design that boosts energy efficiency, demand response, and time-of-use pricing while safeguarding consumer protection and reliable, cleaner power.
Key Highlights
A coalition creating fair, efficient utility rate designs that reward smart energy use and ensure reliable service.
Unites utilities, advocates, and regulators under core principles
Focuses on efficiency, demand response, and time-of-use pricing
Aims to balance consumer protection with utility cost recovery
Templates for regulators expected by next summer
Members include Exelon, PG&E, National Grid, and Southern Company
The Alliance to Save Energy announced Wednesday it has successfully completed the first round of negotiations with a group of utilities and efficiency groups to develop new recommendations that could shape how millions of Americans use and pay for energy in their homes. The group’s members agreed unanimously on a set of core principles guiding their work toward developing new utility rate designs that encourage the efficient and productive use of energy.
The Rate Design Initiative, convened by the Alliance, aims to unite utility and efficiency companies, regulatory leaders, consumer advocates, efficiency groups, and environmental organizations around innovative rate designs that incentivize energy efficiency and clean energy goals, while also addressing adequate cost recovery for utilities. The initiative was launched to support the evolution of utility rate design while balancing the need to support efficiency and environmental performance goals.
“What we’re trying to do is bring all the parties to the table to come up with models for how we can meet these broader societal goals of incentivizing efficiency and delivering cleaner, more reliable power while also making sure that the economics are structured so that consumers are protected and utilities can adequately recover their fixed costs,” said Kelly Speakes-Backman, senior vice president at the Alliance. “It’s a bit of a puzzle that people have been wrestling with for years, but there are some great ideas out there for how we can be smarter about how we’re consuming and paying for electricity. Particularly with all the innovation going on with smart meters, timed appliances and other new technologies, we felt it was time to bring everyone together and try to find some consensus for moving forward in today’s regulatory environment. I think we have the right people at the table, at the right time, to begin to solve this puzzle.”
The group’s work, aimed for completion next summer, passed a key threshold when the initial companies – including Exelon, Ingersoll Rand, Johnson Controls, Lockheed Martin, National Grid, Pacific Gas & Electric, Schneider Electric, Southern Company, Washington Gas and Whirlpool – agreed on core principles guiding the work. The principles can be found here.
For example, Alliant Energy has outlined carbon-neutral electricity plans projected to save billions for ratepayers.
In the coming months, the initiative’s participants will grow to include regulatory experts, consumer advocates and other industry leaders and advocates to continue building consensus and develop more specific recommendations. By next summer, the Alliance hopes to develop four rate design templates that utility regulators across the country could use as guides in setting rates.
Founded in 1977, the Alliance to Save Energy is the leading energy efficiency coalition in the nation – a nonprofit, bipartisan alliance of business, government, environmental and consumer leaders advocating for enhanced energy efficiency across all sectors of the economy.
Related News
Related News

Yale Report on Western Grid Integration: Just Say Yes
Western Grid Integration aligns CAISO with a regional transmission operator under FERC oversight, boosting renewables,…
View more
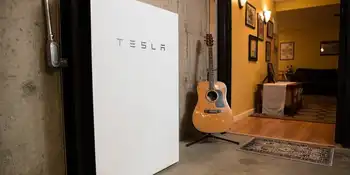
Tesla’s Powerwall as the beating heart of your home
GMP Tesla Powerwall Program replaces utility meters with smart battery storage, enabling virtual power plant…
View more
Florida Power & Light Faces Controversy Over Hurricane Rate Surcharge
FPL Hurricane Surcharge explained: restoration costs, Florida PSC review, rate impacts, grid resilience, and transparency…
View more
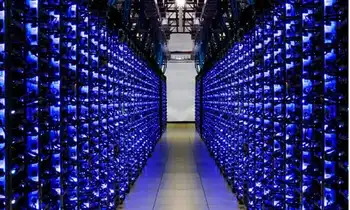
‘Tsunami of data’ could consume one fifth of global electricity by 2025
ICT Electricity Demand is surging as data centers, 5G, IoT, and server farms expand, straining…
View more
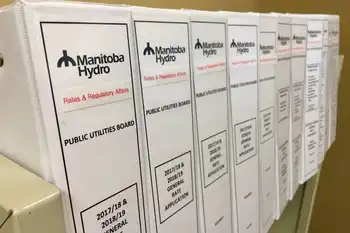
Manitoba Hydro hikes face opposition as hearings begin
Manitoba Hydro rate hikes face public hearings over electricity rates, utility bills, and debt, with…
View more
Canada’s Opportunity in the Global Electricity Market
Canada Clean Electricity Exports leverage hydroelectric power, energy storage, and transmission interconnections to meet rising…
View more
Sign Up for Electricity Forum’s Newsletter
Stay informed with our FREE Newsletter — get the latest news, breakthrough technologies, and expert insights, delivered straight to your inbox.
Electricity Today T&D Magazine Subscribe for FREE

Stay informed with the latest T&D policies and technologies.
- Timely insights from industry experts
- Practical solutions T&D engineers
- Free access to every issue

