
High Voltage Maintenance Training Online
Our customized live online or in‑person group training can be delivered to your staff at your location.

- Live Online
- 12 hours Instructor-led
- Group Training Available
Regular Price:
$599
Coupon Price:
$499
SAN FRANCISCO
—
PG&E property tax payments bolster counties, education, public safety, and infrastructure across Northern and Central California, reflecting semi-annual levies tied to utility assets, capital investments, and economic development that serve 16 million customers.
Context and Background
PG&E property tax payments are semi-annual county taxes funding public services and linked to utility infrastructure.
Over $230M paid to 50 CA counties for Jul 1-Dec 31, 2017
FY 2017-18 property taxes expected at $461M, a 12% increase YoY
PG&E investing $5.9B in 2017 to improve gas and electric systems
Payments aid education, public health, and public safety regionwide
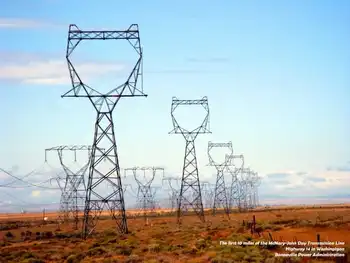
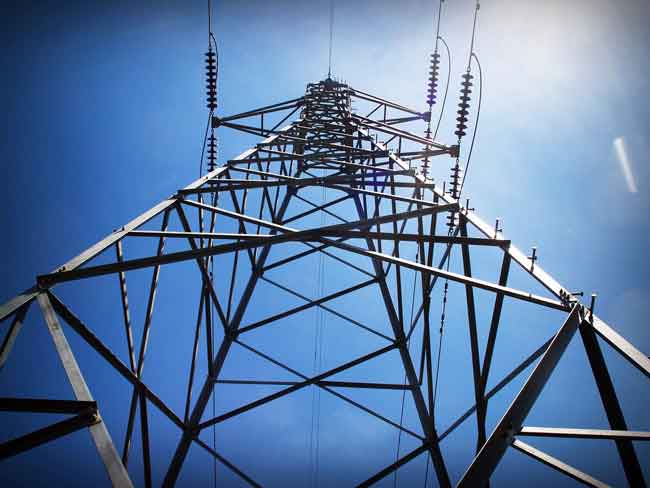
Pacific Gas and Electric Company (PG&E) paid property taxes of more than $230 million this fall to the 50 counties where the energy company owns property and operates gas and electric infrastructure that serves 16 million Californians. The tax payments help support essential public services like education and public health and safety actions across the region.
The semi-annual property tax payments made today cover the period from July 1 to December 31, 2017.
Total payments for the full tax year of July 1, 2017 to June 30, 2018 are estimated to total more than $461 million—an increase of $50 million, or 12 percent, compared with the prior fiscal year, even as customer rates are expected to stabilize in the years ahead.
“Property tax payments provide crucial resources to the many communities where we live and work, supporting everything from education to public safety. By continuing to make local investments in gas and electric infrastructure, we are not only creating one of the safest and most reliable energy systems in the country, including wildfire risk reduction programs and related efforts, we’re investing in the local economy and helping our communities thrive,” said Jason Wells, senior vice president and chief financial officer for PG&E.
PG&E invested more than $5.7 billion last year and expects to invest $5.9 billion this year to enhance and upgrade its gas and electrical infrastructure amid power line fire risks across Northern and Central California.
Some recent investments include the construction of PG&E’s $75 millionGas Safety Academy in Winters in Yolo County, which opened in September. Last year, PG&E opened a $36 million, state-of-the-art electric distribution control center in Rocklin.
PG&E supports the communities it serves in a variety of ways. In 2016, PG&E provided more than $28 million in charitable contributions to enrich local educational opportunities, preserve the environment, and support economic vitality and emergency preparedness and safety, including its Wildfire Assistance Program for impacted residents. PG&E employees provide thousands of hours of volunteer service in their local communities. The company also offers a broad spectrum of economic development services to help local businesses grow.
Related News
Related News
How Synchrophasors are Bringing the Grid into the 21st Century
Synchrophasors deliver PMU-based, real-time monitoring for the smart grid, helping NYISO prevent blackouts, cut costs,…
View more
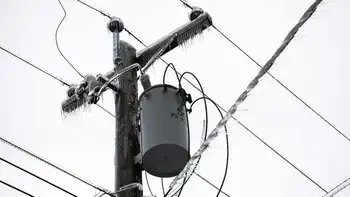
Despite delays, BC Hydro says crews responded well to 'atypical' storm
BC Hydro Ice Storm Response to Fraser Valley power outages highlights freezing rain impacts, round…
View more
Windstorm Causes Significant Power Outages
Vancouver October 2024 Windstorm brought extreme weather to British Columbia, causing power outages, storm damage,…
View more

Scatec Plans EGP 5 Billion Grid Investment to Evacuate Egypt Solar Power
Scatec Egypt grid investment will fund a 500-kV transformer station and 70-km transmission line to…
View more
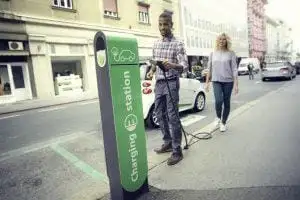
Electric Utilities Plot Bullish Course for EV Charging Infrastructure
EV Charging Infrastructure Incentives are expanding as utilities fund public chargers, Level 2 networks, DC…
View more
Power Outage Affects 13,000 in North Seattle
North Seattle Power Outage disrupts 13,000 in Ballard, Northgate, and Lake City as Seattle City…
View more
Sign Up for Electricity Forum’s Newsletter
Stay informed with our FREE Newsletter — get the latest news, breakthrough technologies, and expert insights, delivered straight to your inbox.
Electricity Today T&D Magazine Subscribe for FREE

Stay informed with the latest T&D policies and technologies.
- Timely insights from industry experts
- Practical solutions T&D engineers
- Free access to every issue

