NFPA 70b Training - Electrical Maintenance
Our customized live online or in‑person group training can be delivered to your staff at your location.

- Live Online
- 12 hours Instructor-led
- Group Training Available
Regular Price:
$699
Coupon Price:
$599
Global Wind Power Growth surged 21%, says GWEC, with Canada up 30% as turbines add megawatts worldwide. China leads capacity; Ontario reviews subsidies amid opposition and calls for a carbon price to drive renewable energy.
What This Means
Annual increase in global wind capacity, driven by new turbines, policy, and demand for renewable power.
- GWEC reports global wind capacity rose 21% year over year.
- Canada up 30%; 5,265 MW now meets about 2.3% of demand.
- China leads at 62,733 MW; US ~47,000; Germany ~29,000.
- New markets grow in Africa, Asia, Latin America, says GWEC.
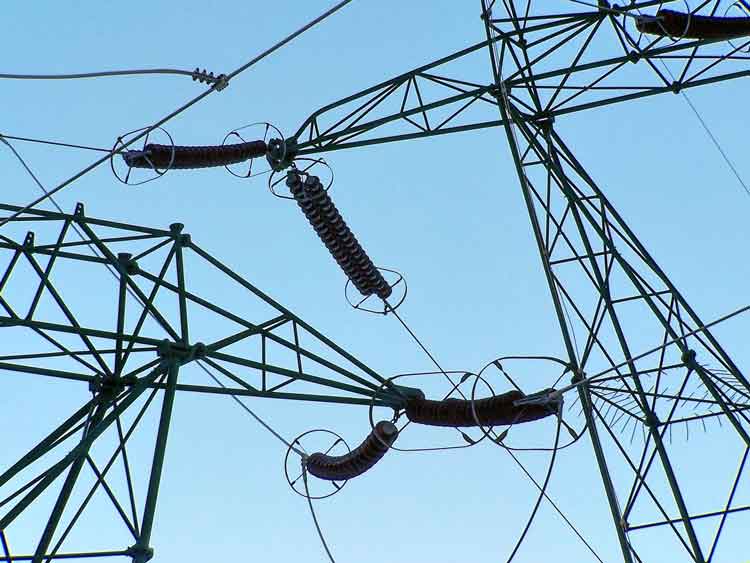
Despite increasingly vocal opposition to the construction of huge wind turbines, the industry is expanding dramatically in Canada and around the world.
Wind power capacity jumped 21 per cent around the world last year, as wind generation technology continues to mature, according to figures released by the Global Wind Energy Council GWEC, a Brussels-based organization that promotes the industry.
In Canada, the increase was even more impressive, reflecting Canadian wind power's biggest year yet across the sector, as capacity leapt more than 30 per cent. There are now turbines capable of generating 5,265 megawatts across the country, building on the 2,000 MW milestone reached earlier, enough power for about 2.3 per cent of Canada’s electricity requirements.
The boost in output comes as Ontario and other jurisdictions across Canada face vocal opposition from groups that say wind turbines are defacing rural landscapes, as projects encounter so-called NIMBY neighbours in many communities, and that potential health issues are not sufficiently understood.
Canada is ninth in the world for wind power production, a ranking unchanged from a year earlier. China remains by far the largest wind power producer – it makes up more than a quarter of the world market, with a capacity of 62,733 megawatts. The United States is second with about 47,000 MW, and Germany is third at around 29,000 MW.
China is also growing at the fastest pace, having added 18,000 MW of wind power in the past year.
GWEC secretary general Steve Sawyer said wind installations are also growing quickly in new markets in Africa, Asia and Latin America. He said growth rates will not be maintained, however, “unless there is a global price on carbon, which would force greenhouse gas-emitting forms of power to pay penalties, and give credits to green power producers.”
Canadian Wind Energy Association president Robert Hornung said Canada needs aggressive targets for wind energy development, and a “stable policy framework.”
Still, in 2011 more than 1,200 MW of wind capacity was added across Canada. In 2012, CanWEA predicts another 1,500 MW will be added in Quebec, Ontario, Alberta, British Columbia, P.E.I. and Nova Scotia, a year in which wind energy grew almost 20 per cent worldwide.
Ontario – Canada’s largest market for wind power – is reviewing its policies supporting renewable energy, as the industry grows amid opposition nationwide. The province is expected to make some changes soon to its electricity pricing structure, likely reducing some of the subsidies for wind, solar and other green energy production.
Last month, the Ontario Federation of Agriculture, the largest farm organization in the province, called for a moratorium on wind power development. The OFA said there are too many unanswered questions about the value and impact of wind power, municipalities have been unfairly cut out of the decision-making process, even as advocates push for going green without disrupting the environment through careful siting, and the debate over turbines is polarizing rural communities.
Jane Wilson, president of anti-wind lobby group Wind Concerns Ontario, acknowledged that “in the short term, certainly, there is a major push to get more projects approved and built.” However, she added, more and more individuals and groups are “saying this is all happening way too fast … let’s put the brakes on.”
The opposition is not confined to Canada. Last week, more than 100 British members of parliament wrote to Prime Minister David Cameron calling for a sharp cut to subsidies for on-shore wind, which they said is “inefficient and intermittent.” They asked that the money go to other forms of renewable energy as well as energy efficiency programs.
The MPs also complained that the approvals process makes it too hard for local residents to defeat unwanted wind farm proposals.
Related News
Related News
Bright Feeds Powers Berlin Facility with Solar Energy
Bright Feeds Solar Upgrade integrates a 300-kW DC PV system and 625 solar panels at…
View more

Winter Storm Leaves Many In Texas Without Power And Water
Texas Power Grid Crisis strains ERCOT as extreme cold, ice storms, and heavy snow trigger…
View more
New England's solar growth is creating tension over who pays for grid upgrades
New England Solar Interconnection Costs highlight distributed generation strains, transmission charges, distribution upgrades, and DAF…
View more

Power bill cut for 22m Thailand houses
Thailand Covid-19 Electricity Bill Relief offers energy subsidies, tariff cuts, and free power for small…
View more
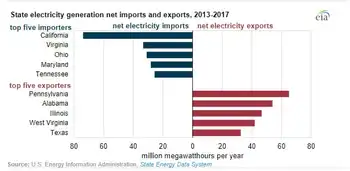
EIA: Pennsylvania exports the most electricity, California imports the most from other states
U.S. Electricity Trade by State, 2013-2017 highlights EIA grid patterns, interstate imports and exports, cross-border…
View more

Sens. Wyden, Merkley Introduce Bill to Ensure More Wildfire Resilient Power Grid
Wildfire Resilient Power Grid Act proposes DOE grants for utility companies to fund wildfire mitigation,…
View more
Sign Up for Electricity Forum’s Newsletter
Stay informed with our FREE Newsletter — get the latest news, breakthrough technologies, and expert insights, delivered straight to your inbox.
Electricity Today T&D Magazine Subscribe for FREE

Stay informed with the latest T&D policies and technologies.
- Timely insights from industry experts
- Practical solutions T&D engineers
- Free access to every issue

