Will consumers plug into home energy displays?
By CNET News
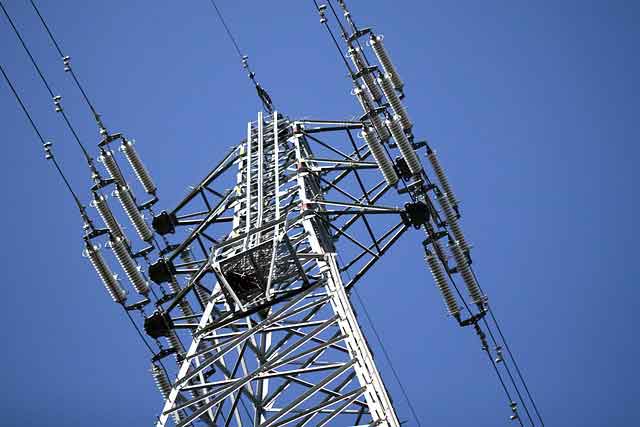
Substation Relay Protection Training
Our customized live online or in‑person group training can be delivered to your staff at your location.

- Live Online
- 12 hours Instructor-led
- Group Training Available
Whole home energy monitors, or displays, are designed to help consumers conserve energy by providing far more detailed information than a monthly bill. These types of devices are already available, but millions more are poised to enter U.S. homes in the next two years, largely through utility-run smart grid programs.
The gadgets themselves vary, but the common thread among them is the ability to capture a stream of energy information from a meter at a given moment. Simply by surfacing real-time data, either with a small device or Web software, it's believed the system will prompt people to change their habits and ratchet down consumption by 5 percent to 15 percent, according to studies.
But even as more sophisticated and user-friendly products come to market, it's unclear whether consumers will track energy use regularly, particularly once the novelty wears off.
"Not everybody is an energy nerd yet," said David Schatsky, principal at consulting company GreenResearch. "While people who study this area are aware of the energy space, the average consumer is not."
Schatsky recently completed a study on home energy displays and concluded that they won't likely be a hot holiday season gift anytime soon. In the next two to three years, he projects there will be millions of these devices installed, with the numbers ramping up to tens of millions after that. Existing displays cost roughly $100 to $200 but Schatsky expects that many consumers will initially receive them for free from utilities as part of smart-grid programs.
In a survey, he found that about half of consumers said they were interested in tools to lower home energy bills. But in reality, the percentage of people who will actively manage their energy is probably much less. There are also technical hurdles to making these devices provide real-time information and useful recommendations.
As a result, he expects that energy-efficiency programs run by utilities in the next few years will drive adoption and provide some lessons on what resonates with consumers and not. As part of the multi-billion dollar smart-grid grant program announced last month, about one million consumers will get in-home displays from utilities looking to lower consumers' energy consumption in smart-grid programs. Those programs are expected to get off the ground in the next few months.
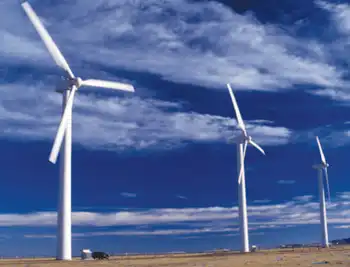
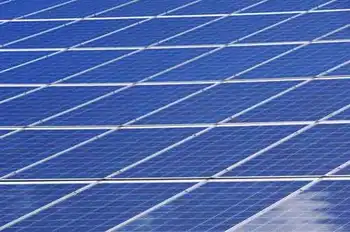
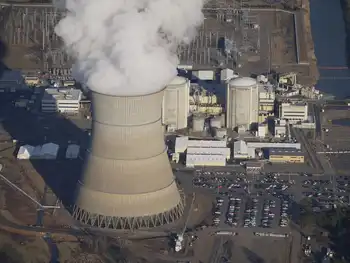
The drive behind smart-grid technologies is to enable the grid to use electricity more efficiently, integrate more solar and wind power, and potentially eliminate the need to build new power plants to meet growing demand.
Countries around the world are investing to upgrade their grids, but there's a gnawing concern in the U.S. that consumers aren't sold on the benefits. Home energy displays are supposed to be one of the ways that utilities can help consumers save money and lighten their environment footprint.
At their most simple, a whole-house energy monitor shows what's happening on an electricity meter and translates that into cost and kilowatt-hours. For example, seeing that a home's current electricity use is higher than typical could lead a person to unplug a video game console or turn off lights. More sophisticated devices can provide information on how much individual appliances use and generate statistics.
When used as part of smart meter rollout, these devices can be a gateway for energy-efficiency services offered by a utility, such as demand response. For instance, a monitor can employ a color system where red indicates that the electricity rate has gone up because it's a time of peak demand.
The Web is a natural extension to these energy gadgets. Google's PowerMeter is being offered through utilities that install smart meters, which feed real-time energy use to the Web-based monitoring application. But Google is starting to offer PowerMeter through other devices, including a small monitor called the TED 5000.
The information and displays are meant to not only inform consumers but to motivate them to be more efficient. In order for that to work, the devices need to be simple to install and useful just at a glance, say monitor makers.
"There's all this talk about the smart grid, but if customers don't participate, it will be a bust," said Paul Nagel, the vice president of strategic development at home automation start-up Control4. "If they don't engage, then they'll never get energy savings."
One of the challenges that all energy display companies face is the technical barriers to getting them installed. The most sophisticated system would use a home-area network built around a smart meter and a network of Zigbee-enabled appliances and thermostat. But even with big investments in the smart grid, millions of homes still won't have smart meters.
Energy management companies are developing alternatives for getting data regularly from the meter to a display. Bridge devices can read meter information using the automatic meter reading (AMR) protocol, which is already available in millions of meters. Another approach is to clamp sensors onto a circuit box to get data or to install "smart plugs," which transmit data from appliances.
Even if a consumer is willing to navigate these technical issues, there is the question of whether the device will provide energy savings over time.
New home energy management companies are focusing on doing more than just monitor data because they are worried about what's called "mean time to kitchen drawer." That is, a person may have a small display on a kitchen counter as a reminder about energy use. But when the batteries run out, will they simply stash it in a kitchen drawer and forget about it?
Companies are now building in data analytics to provide recommendations or to automatically control appliances to ratchet down energy use. EcoFactor, for example, is developing a hosted software application that can analyze data from wireless thermostats and make changes to make the home more efficient.
Control4, a company which does touch-screen displays to manage video and music in a home, is now branching into energy management. Its EMS 100 device, which runs Linux on an Arm 9 processor, is powerful enough to analyze daily information to provide recommendations on how consumers can make changes to save energy, said Nagel. The company plans to offer it through utilities starting in the first quarter of next year.
Energy management services could be bundled with other home-automation products or even cable and telecom services. iControl and AlertMe in the UK plan to bundle security services with tools to manage heating, cooling, and lighting.
One way that utilities and energy management companies expect to motivate consumers is by comparing one home's usage to neighbors in comparably sized homes. Start-up Grounded Power is using social science techniques already proven with recycling and seat belt programs to encourage consumers to save energy, said Mike Bukhin, the vice president of engineering.
"Our users are taking snapshots of data subsets and comparing their data to others' in the community. 'How does my fridge compare to yours?' They also have the ability to ask resident experts questions about their data. The data in turn is shared with the rest of the community," he said.