CSA Z463 Electrical Maintenance -
Our customized live online or in‑person group training can be delivered to your staff at your location.

- Live Online
- 6 hours Instructor-led
- Group Training Available
Regular Price:
$249
Coupon Price:
$199
TORONTO
—
Canada Solar Capacity Outlook 2022-2050 projects 500 MW new PV in 2022 and 35 GW by 2050, driven by renewables policy, grid parity, NREL analysis, IEA-PVPS data, and competitive utility-scale photovoltaic costs.
The Big Picture
An evidence-based forecast of Canadian PV additions to 35 GW by 2050, reflecting policy, costs, and grid parity trends.
500 MW PV expected in 2022; cumulative capacity near 5 GW
NREL outlook sees 35 GW by 2050 on cost competitiveness
Policy shifts, ITCs, coal retirements accelerate solar uptake
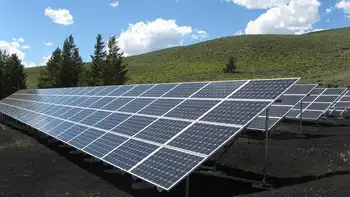
Canada is set to install 500 MW of new solar in 2022, bringing its total capacity to about 5 GW, according to data from Canmet Energy, even as the Netherlands outpaces Canada in solar power generation. The country is expected to hit 35 GW of total solar capacity by 2050.
Canada’s cumulative solar capacity is set to hit 5 GW by the end of this year, according to figures from the federal government’s Canmet Energy lab. The country is expected to add around 500 MW of new solar capacity, from 944 MW last year, according to the International Energy Agency Photovoltaic Power Systems Programme (IEA-PVPS), which recently published a report on PV applications in Canada, even as solar demand lags in Canada.
“If we look at the recent averages, Canada has installed around 500 MW annually. I expect in 2022 it will be at least 500 MW,” said Yves Poissant, research manager at Canmet Energy. “Last year it was 944 MW, mainly because of a 465 MW centralized PV power plant installed in Alberta, where the Prairie Provinces are expected to lead national renewable growth.”
The US National Renewable Energy Laboratory (NREL) studied renewables integration and concluded that Canada’s cumulative solar capacity will increase sevenfold to 35 GW by 2050, driven by cost competitiveness and that zero-emissions by 2035 is achievable according to complementary studies.
Canada now produces 80% of its electricity from power sources other than oil. Hydroelectricity leads the mix at 60%, followed by nuclear at 15%, wind at 7%, gas and coal at 7%, and PV at just 1%. While the government aims to increase the share of green electricity to 90% by 2030 and 100% by 2050, zero-emission electricity by 2035 is considered practical and profitable, yet it has not set any specific goals for PV. Each Canadian province and territory is left to determine its own targets.
“Without comprehensive pan-Canadian policy framework with annual capacity targets, PV installation in the coming years will likely continue to be highly variable across the provinces and territories, especially after Ontario scrapped a clean energy program, which scaled back growth projections. Further policies mechanisms are needed to allow PV to reach its full potential,” the IEA-PVPS said.
Popular content
Canada recently introduced investment tax credits for renewables to compete with the United States, but it is still far from being a solar powerhouse, with some experts calling it a solar laggard today. That said, the landscape has started to change in the past five years.
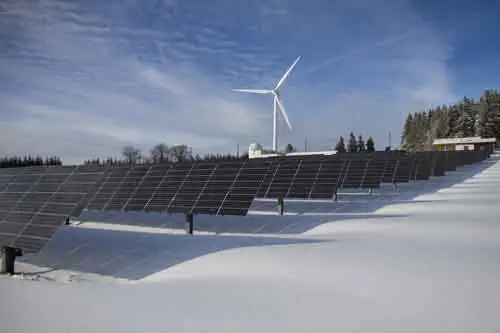
“Some laws have been put in place to retire coal plants by 2025. That led to new opportunities to install capacity,” said Poissant. “We expect the newly installed capacity will consist mostly of wind, but also solar.”
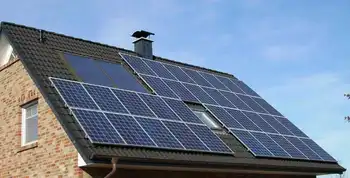
The cost of solar has become more competitive and the residential sector is now close to grid parity, according to Poissant. For utility-scale projects, old hydroelectric dams are still considerably cheaper than solar, but newly built installations are now more expensive than solar.
“Starting 2030, solar PV will be cost competitive compared to wind,” Poissant said.
Related News
Related News
Is residential solar worth it?
Home Solar Cost vs Utility Bills compares electricity rates, ROI, incentives, and battery storage, explaining…
View more
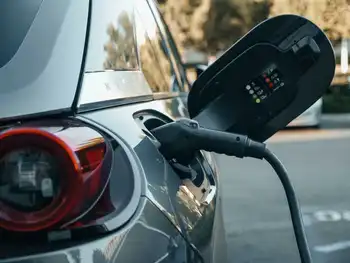
EV Boom Unexpectedly Benefits All Electricity Customers
Electric Vehicles Lower Electricity Rates by boosting demand, enabling fixed-cost recovery, and encouraging off-peak charging…
View more
IEA: Clean energy investment significantly outpaces fossil fuels
Clean Energy Investment is surging as renewables, electric vehicles, grids, storage, and nuclear outpace fossil…
View more

California looks to electric vehicles for grid stability
California EV V2G explores bi-directional charging, smart charging, and demand response to enhance grid reliability.…
View more

The Spanish inventor creating electricity from plants
Bioo Soil-Generated Electricity turns biological batteries and photosynthesis into renewable energy, powering IoT sensors for…
View more
Alberta Leads Canada’s Renewable Surge
Alberta Leads Canada’s Renewable Surge showcases how the province is transforming its power grid with…
View more
Sign Up for Electricity Forum’s Newsletter
Stay informed with our FREE Newsletter — get the latest news, breakthrough technologies, and expert insights, delivered straight to your inbox.
Electricity Today T&D Magazine Subscribe for FREE

Stay informed with the latest T&D policies and technologies.
- Timely insights from industry experts
- Practical solutions T&D engineers
- Free access to every issue

