Why Electric Vehicles Are "Greener" Than Ever In All 50 States


ev states

Protective Relay Training - Basic

Our customized live online or in‑person group training can be delivered to your staff at your location.

  • Live Online
  • 12 hours Instructor-led
  • Group Training Available
Regular Price:
$699
Coupon Price:
$599
Reserve Your Seat Today

UCS EV emissions study shows electric vehicles produce lower life-cycle emissions than gasoline cars across all states, factoring tailpipe, grid mix, power plant sources, and renewable energy, delivering mpg-equivalent advantages nationwide.


Key Points

UCS study comparing EV and gas life-cycle emissions, finding EVs cleaner than new gas cars in every U.S. region.

✅ Average EV equals 93 mpg gas car on emissions.

✅ Cleaner than 50 mpg gas cars in 97% of U.S.

✅ Regional grid mix included: tailpipe to power plant.


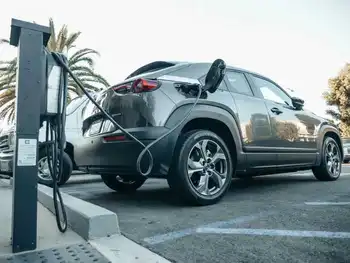
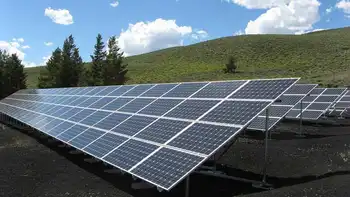
One of the cautions cited by electric vehicle (EV) naysayers is that they merely shift emissions from the tailpipe to the local grid’s power source, implicating state power grids as a whole, and some charging efficiency claims get the math wrong, too. And while there is a kernel of truth to this notion—they’re indeed more benign to the environment in states where renewable energy resources are prevalent—the average EV is cleaner to run than the average new gasoline vehicle in all 50 states. 

That’s according to a just-released study conducted the Union of Concerned Scientists (UCS), which determined that global warming emissions related to EVs has fallen by 15 percent since 2018. For 97 percent of the U.S., driving an electric car is equivalent or better for the planet than a gasoline-powered model that gets 50 mpg. 

In fact, the organization says the average EV currently on the market is now on a par, environmentally, with an internal combustion vehicle that’s rated at 93 mpg. The most efficient gas-driven model sold in the U.S. gets 59 mpg, and EV sales still trail gas cars despite such comparisons, with the average new petrol-powered car at 31 mpg.

For a gasoline car, the UCS considers a vehicle’s tailpipe emissions, as well as the effects of pumping crude oil from the ground, transporting it to a refinery, creating gasoline, and transporting it to filling stations. For electric vehicles, the UCS’ environmental estimates include both emissions from the power plants themselves, along with those created by the production of coal, natural gas or other fossil fuels used to generate electricity, and they are often mischaracterized by claims about battery manufacturing emissions that don’t hold up. 

Of course the degree to which an EV ultimately affects the atmosphere still varies from one part of the country to another, depending on the local power source. In some parts of the country, driving the average new gasoline car will produce four to eight times the emissions of the average EV, a fact worth noting for those wondering if it’s the time to buy an electric car today. The UCS says the average EV driven in upstate New York produces total emissions that would be equivalent to a gasoline car that gets an impossible 255-mpg. In even the dirtiest areas for generating electricity, EVs are responsible for as much emissions as a conventionally powered car that gets over 40 mpg.


Related News

Related News

Requests for Proposal launched for purchase of clean electricity in Alberta

Canada Clean Electricity Procurement advances federal operations with renewable energy in Alberta, leveraging RECs, competitive sourcing, Indigenous participation, and grid decarbonization to cut greenhouse gas emissions and stimulate new clean power infrastructure.


Key Points

A plan to procure clean power and RECs, cutting emissions in Alberta and attributing use where renewables are absent.

✅ RFPs to source new clean electricity in Alberta

✅ RECs from net new Canadian renewable generation

✅ Mandatory Indigenous participation via equity or set-asides


Public Services and Procurement Canada (PSPC) is taking concrete steps to meet the Government of Canada's commitment in the Greening Government Strategy to reduce greenhouse gas emissions from federal government buildings, vehicle fleets and other operations, aligning with broader vehicle electrification trends across Canada.

The Honourable Anita Anand, Minister of Public Services and Procurement, announced the Government of Canada has launched Requests for Proposal to buy new clean electricity in the province of Alberta, which is moving ahead with the retirement of coal power to clean its grid, to power federal operations there.

As well, Canada will purchase Renewable Energy Certificates (REC) from new clean energy generation in Canada. This will enable Canada to attribute its energy consumption as clean in regions where new clean renewable sources are not yet available. The Government of Canada is excited about this opportunity to stimulate net new Canadian clean electricity generation through the procurement of RECs and complementary power purchase agreements that secure long-term supply for federal demand.

Together, these contracts will help to ensure Canada is reducing its greenhouse gas footprint by approximately 133 kilotonnes or 56% of total real property emissions in Alberta. Additionally, the contracts will displace approximately 41 kilotonnes of greenhouse gas emissions from electricity use in the rest of Canada, supporting progress toward 2035 clean electricity goals even as challenges remain.

Through these open, fair and transparent competitive procurement processes, PSPC will be a key purchaser of clean electricity and will support the growth of new clean electricity and renewable power infrastructure, such as recent turbine investments in Manitoba that expand capacity.

The Government of Canada's Clean Electricity Initiative plans to use 100% clean electricity by 2022, where available, in alignment with evolving net-zero electricity regulations that shape supply choices, to reduce greenhouse gas emissions and stimulate growth in clean renewable power infrastructure. PSPC has applied the goals of the Government of Canada's Clean Electricity Initiative to its specific requirement for net new clean electricity generation to power federal operations in Alberta.  

These procurements will support economic opportunities for Indigenous businesses by encouraging participation in the move towards clean energy, seen in provincial shifts toward clean power in Ontario that broaden markets. Each Request for Proposal incorporates mandatory requirements for Indigenous participation through equity holdings or set-asides under the Procurement Strategy for Aboriginal Business.


Related News

View more

Four effective ways to meet US decarbonization goals

US Grid Decarbonization demands balancing renewables, reliability, and resilience with smart transmission, storage, siting, and demand response, leveraging digital asset management to modernize infrastructure while meeting climate goals and rising electricity consumption.


Key Points

Low-carbon power while maintaining reliability via renewables, storage, transmission, and digital operations.

✅ Siting wind and solar requires community engagement and environmental review

✅ Balance variable renewables with storage, flexible load, and firm capacity

✅ Modernize transmission and digitize asset data for reliable operations


Last week, over 13,000 energy and technology leaders arrived in Dallas for DISTRIBUTECH International to share knowledge, showcase new technology advancements, and discuss initiatives to prepare for the future of energy. Among the many topics discussed was the critical need to balance rising energy demands and environmental pressures while understanding why the grid isn't 100% renewable today alongside effective climate change solutions.

The most widespread source of energy consumption is electricity. According to The U.S. Energy Information Administration, 2020 electricity consumption rates were roughly 3.8 trillion kWh - 13 times higher than in 1950. With our ever-increasing reliance on electricity, renewables' share of generation is also rising and this number is sure to grow exponentially in the coming years.

How can the US achieve meaningful decarbonization goals without sacrificing reliable and stable energy? Here are 4 of the biggest challenges and practical ways to meet them:


Siting New Solar and Wind Farms
Building renewable energy sources is more difficult than it seems. Scouting for sites is fraught with issues such as community opposition due to local aesthetics and clean energy's hidden costs around disruption to the environment and recreation.

NIMBY (Not In My Backyard) is an influential source of opposition. Local residents join together in an effort to prevent shore front views in wealthy coastal areas from obstruction, which are needed to support offshore wind farms. These farms can also negatively impact local fisheries, while outdoor sports and entertainment activities such as sailing, waterskiing, fishing, or swimming may be disrupted, which are equally opposed by NIMBY advocates.

Utilities must take these concerns into account when scouting for renewable energy sites.


Maintaining Consistent Availability of Generation Capacity
The capacity to generate consistent, reliable electricity is both a regional and nationwide concern.

Wind and solar farms depend on a consistent level of wind velocity and sunny periods, yet wind and solar could meet 80% of U.S. demand and regional concerns must be considered. For example, the southwestern United States is an ideal location for large commercial solar arrays. Areas in the north are more problematic since fall and winter days are shorter, reducing their ability to consistently generate energy. The Midwest is a prime location for wind-based generation since it experiences a consistent level of wind throughout the year.

Nighttime periods and cloudy days virtually eliminate solar farms as a consistent energy source while loss of available winds impacts the reliability of wind as a base load supply of energy generation.


Pivoting From Current Energy Usage Models
Over the last 20 years, utilities have been heavily involved with normalizing consumer energy consumption curves, pursuing grid resilience strategies to manage variability. Due to the high cost of siting new fossil fuel facilities, building new electric grid interconnections, and the high commodity pricing for imported power, utilities were driven to modify their customers’ energy usage patterns.

These consumption regulating policies included:

  • Time of use metering to entice customers to use high energy devices at night
  • Installation of energy monitoring devices on high use customer equipment to enable the utility to reduce energy demand during peak use periods
  • Charging electric vehicles overnight

With fundamental changes occurring in how energy is generated, the availability of renewable power during low or no-sun periods and lower wind levels will require utilities to alter their energy consumption models.


Utilizing Government Support of New Electric Infrastructure
With the proposed government infusion of funds, including a rule to boost renewable transmission, to build and modernize infrastructures, utility leaders will be ideally positioned to drastically improve the reliability of the US electric grid.

Utilities will be involved in aggressive transmission line building projects to ensure the effective distribution of energy across multiple state lines, aligning with the U.S. grid overhaul for renewables underway today. This expansive build out of the US transmission and distribution system will create a dramatic increase in the need to accurately document the location and details of the new utility assets for current tracking and future analysis needs.

Energy leaders must seek advanced technology to provide them with solutions for precisely this purpose. Manual, paper-based field data collection must be replaced with digital workflows which automate and simplify asset data capture and analysis. Continued reliance on manual methods will cause them to lag behind the industry and impede their ability to support renewable energy for the modern era.


Related News

View more

World renewable power on course to shatter more records

Global Renewable Capacity Additions 2023 surge on policy momentum, high fossil prices, and energy security, with solar PV and wind leading growth as grids expand and manufacturing scales across China, Europe, India, and the US.


Key Points

Record solar PV and wind growth from policy and energy security, adding 440+ GW toward 4,500 GW total capacity in 2024.

✅ Solar PV to supply two-thirds of additions; rooftop demand rising.

✅ Wind rebounds ~70% as delayed projects complete in China, EU, US.

✅ Grid upgrades and better permitting, auctions key for 2024 growth.


Global additions of renewable power capacity are expected to jump by a third this year as growing policy momentum, higher fossil fuel prices and energy security concerns drive strong deployment of solar PV and wind power, building on a record year for renewables in 2016, according to the latest update from the International Energy Agency.

The growth is set to continue next year with the world’s total renewable electricity capacity rising to 4 500 gigawatts (GW), equal to the total power output of China and the United States combined, and in the United States wind power has surged in the electricity mix, says the IEA’s new Renewable Energy Market Update, which was published today.

Global renewable capacity additions are set to soar by 107 gigawatts (GW), the largest absolute increase ever, to more than 440 GW in 2023. The dynamic expansion is taking place across the world’s major markets. Renewables are at the forefront of Europe’s response to the energy crisis, accelerating their growth there. New policy measures are also helping drive significant increases in the United States, where solar and wind growth remains strong, and India over the next two years. China, meanwhile, is consolidating its leading position and is set to account for almost 55% of global additions of renewable power capacity in both 2023 and 2024.

“Solar and wind are leading the rapid expansion of the new global energy economy. This year, the world is set to add a record-breaking amount of renewables to electricity systems – more than the total power capacity of Germany and Spain combined,” said IEA Executive Director Fatih Birol. “The global energy crisis has shown renewables are critical for making energy supplies not just cleaner but also more secure and affordable – and governments are responding with efforts to deploy them faster. But achieving stronger growth means addressing some key challenges. Policies need to adapt to changing market conditions, and we need to upgrade and expand power grids to ensure we can take full advantage of solar and wind’s huge potential.”

Solar PV additions will account for two-thirds of this year’s increase in renewable power capacity and are expected to keep growing in 2024, according to the new report. The expansion of large-scale solar PV plants is being accompanied by the growth of smaller systems. Higher electricity prices are stimulating faster growth of rooftop solar PV, which is empowering consumers to slash their energy bills, and in the United States renewables' share is projected to approach one-fourth of electricity generation.

At the same time, manufacturing capacity for all solar PV production segments is expected to more than double to 1 000 GW by 2024, led by China's solar PV growth and increasing supply diversification in the United States, where wind, solar and battery projects dominate the 2023 pipeline, India and Europe. Based on those trends, the world will have enough solar PV manufacturing capacity in 2030 to comfortably meet the level of annual demand envisaged in the IEA’s Net Zero Emissions by 2050 Scenario.

Wind power additions are forecast to rebound sharply in 2023 growing by almost 70% year-on-year after a difficult couple of years in which growth was slugging, even as wind power still grew despite Covid-19 challenges. The faster growth is mainly due to the completion of projects that had been delayed by Covid-19 restrictions in China and by supply chain issues in Europe and the United States. However, further growth in 2024 will depend on whether governments can provide greater policy support to address challenges in terms of permitting and auction design. In contrast to solar PV, wind turbine supply chains are not growing fast enough to match accelerating demand over the medium-term. This is mainly due to rising commodity prices and supply chain challenges, which are reducing the profitability of manufacturers.

The forecast for renewable capacity additions in Europe has been revised upwards by 40% from before Russia’s invasion of Ukraine, which led many countries to boost solar and wind uptake to reduce their reliance on Russian natural gas. The growth is driven by high electricity prices that have made small-scale rooftop solar PV systems more financially attractive and by increased policy support in key European markets, especially in Germany, Italy and the Netherlands.


Related News

View more

DOE Issues Two LNG Export Authorizations

DOE LNG Export Approvals expand flexibility for Cheniere's Sabine Pass and Corpus Christi to ship to non-FTA countries, boosting U.S. supply to Europe while advancing methane emissions reductions and strengthening global energy security.


Key Points

DOE LNG export approvals authorize Sabine Pass and Corpus Christi to sell full-capacity LNG to non-FTA markets.

✅ Exports allowed to any non-FTA country, including Europe

✅ Capacity covers Sabine Pass and Corpus Christi terminals

✅ DOE targets methane reductions across oil and gas


The U.S. Department of Energy (DOE) today issued two long-term orders authorizing liquefied natural gas (LNG) exports from two current operating LNG export projects, Cheniere Energy Inc.’s Sabine Pass in Louisiana and Corpus Christi in Texas, following a recent deep freeze that slammed the American energy sector.

The two orders allow Sabine Pass and Corpus Christi additional flexibility to export the equivalent of 0.72 billion cubic feet per day of natural gas as LNG to any country with which the U.S. does not have a free trade agreement, including all of Europe, such as the UK natural gas market as well.

While U.S. exporters are already exporting at or near their maximum capacity, with today's issuances, every operating U.S. LNG export project has approval from DOE to export its full capacity to any country where not prohibited by U.S. law or policy constraints in place.

The U.S. is now the top global exporter of LNG and exports are set to grow an additional 20% beyond current levels by the end of this year as additional capacity comes online, even as a domestic energy crisis influences electricity and gas markets.  In January 2022, U.S. LNG supplied more than half of the LNG imports into Europe for the month.

With the expected rise in LNG exports, DOE is particularly focused on driving down methane emissions in the oil and gas sector both domestically and abroad, leveraging the deep technical expertise of the Department, and supporting nuclear innovation as well.

U.S. LNG remains an important component to global energy security worldwide and DOE remains committed to finding ways to help our allies and trading partners, including support to Ukraine and others with the energy supplies they need while continuing to work to mitigate the impact of climate change.


Related News

View more

EV Boom Unexpectedly Benefits All Electricity Customers

Electric Vehicles Lower Electricity Rates by boosting demand, enabling fixed-cost recovery, and encouraging off-peak charging that balances the grid, reduces peaker plant use, and funds utility upgrades, with V2G poised to expand system benefits.


Key Points

By boosting off-peak demand and utility revenue, EVs spread fixed costs, cut peaker use, and stabilize the grid.

✅ Off-peak charging flattens load, reducing peaker plant reliance

✅ Higher kWh sales spread fixed grid costs across more users

✅ V2G can supply power during peaks and emergencies


Electric vehicles (EVs) are gaining popularity, and it appears they might be offering an unexpected benefit to everyone – including those who don't own an EV.  A new study by the non-profit research group Synapse Energy Economics suggests that the growth of electric cars is actually contributing to lower electricity rates for all ratepayers.


How EVs Contribute to Lower Rates

The study explains several factors driving this surprising trend:

  • Increased Electricity Demand: Electric vehicles require additional electricity, boosting rising electricity demand on the grid.
  • Optimal Charging Times: Many EV owners take advantage of off-peak charging discounts. Charging cars overnight, when electricity demand is typically low, helps to balance state power grids and reduce the need for expensive "peaker" power plants, which are only used to meet occasional spikes in demand.
  • Revenue for Utilities: Electric car charging can generate substantial revenue for utilities, potentially supporting investment in grid improvements, energy storage solutions and renewable energy projects that can bring long-term benefits to all customers.


A Significant Impact

The Synapse Energy Economics study analyzed data from 2011 to 2021 and concluded that EV drivers already contributed over $3 billion more to the grid than their associated costs. That, in turn, reduced monthly electricity bills for all customers.


Benefits May Grow

While the impact on electricity rates has been modest so far, experts anticipate the benefits to grow as EV adoption rates increase. Vehicle-to-grid (V2G) technology, which allows EVs to feed stored power back into the grid during emergencies or high-demand periods, has the potential to further optimize electricity usage patterns and create additional benefits for electric utilities and customers.


National Implications

The findings of this study offer hope to other regions seeking to increase electric vehicle adoption rates and support California's grid stability efforts, which is a key step towards reducing transportation-related greenhouse gas emissions. This news may alleviate concerns about potential electricity rate hikes driven by EV adoption and suggests that the benefits will be broadly shared.


More than Just Environmental Benefits

Electric vehicles bring a clear environmental advantage by reducing reliance on fossil fuels. However, this unexpected economic benefit could further strengthen the case for accelerating the adoption of electric vehicles. This news might encourage policymakers and the public to consider additional incentives or policies, including vehicle-to-building charging approaches, to promote the transition to this cleaner mode of transportation knowing it can yield benefits beyond environmental goals.


Related News

View more

Is residential solar worth it?

Home Solar Cost vs Utility Bills compares electricity rates, ROI, incentives, and battery storage, explaining payback, financing, and grid fees while highlighting long-term savings, rate volatility, and backup power resilience for homeowners.


Key Points

Compares home solar pricing and financing to utility rates, outlining savings, incentives, ROI, and backup power value.

✅ Average retail rates rose 59% in 20 years; volatility persists

✅ Typical 7.15 kW system costs $18,950 before incentives

✅ Federal ITC and state rebates improve ROI and payback


When shopping for a home solar system, sometimes the quoted price can leave you wondering why someone would move forward with something that seems so expensive. 

When compared with the status quo, electricity delivered from the utility, the price may not seem so high after all. First, pv magazine will examine the status quo, and how much you can expect to pay for power if you don’t get solar panels. Then, we will examine the average cost of solar arrays today and introduce incentives that boost home solar value.

The cost of doing nothing

Generally, early adopters have financially benefited from going solar by securing price certainty and stemming the impact of steadily increasing utility-bill costs, particularly for energy-insecure households who pay more for electricity.

End-use residential electric customers pay an average of $0.138/kWh in the United States, according to the Energy Information Administration (EIA). In California, that rate is $0.256/kWh, it averages $0.246/kWh across New England, $0.126/kWh in the South Atlantic region, and $0.124/kWh in the Mountain West region.

EIA reports that the average home uses 893 kWh per month, so based on the average retail rate of $0.138/kWh, that’s an electric bill of about $123 monthly, or $229 monthly in California.

Over the last 20 years, EIA data show that retail electricity prices have increased 59% across the United States, with evidence indicating that renewables are not making electricity more expensive, suggesting other factors have driven costs higher, or 2.95% each year.

This means based on historical rates, the average US homeowner can expect to pay $39,460 over the next 20 years on electricity bills. On average, Californians could pay $73,465 over 20 years.

Recent global events show just how unstable prices can be for commodities, and energy is no exception here, with solar panel sales doubling in the UK as homeowners look to cut soaring bills. What will your utility bill cost in 20 years?

These estimated bills also assume that energy use in the home is constant over 20 years, but as the United States electrifies its homes, adds more devices, and adopts electric vehicles, it is fair to expect that many homeowners will use more electricity going forward.

Another factor that may exacerbate rate raising is the upgrade of the national transmission grid. The infrastructure that delivers power to our homes is aging and in need of critical upgrades, and it is estimated that a staggering $500 billion will be spent on transmission buildout by 2035. This half-trillion-dollar cost gets passed down to homeowners in the form of raised utility bill rates.

The benefit of backup power may increase as time goes on as well. Power outages are on the rise across the United States, and recent assessments of the risk of power outages underscore that outages related to severe weather events have doubled in the last 20 years. Climate change-fueled storms are expected to continue to rise, so the role of battery backup in providing reliable energy may increase significantly.

The truth is, we don’t know how much power will cost in 20 years. Though it has increased 59% across the nation in the last 20 years, there is no way to be certain what it will cost going forward. That is where solar has a benefit over the status quo. By purchasing solar, you are securing price certainty going forward, making it easier to budget and plan for the future.

So how do these costs compare to going solar?

Cost of solar

As a general trend, prices for solar have fallen. In 2010, it cost about $40,000 to install a residential solar system, and since then, prices have fallen by as much as 70%, and about 37% in the last five years. However, prices have increased slightly in 2022 due to shipping costs, materials costs, and possible tariffs being placed on imported solar goods, and these pressures aren’t expected to be alleviated in the near-term.

When comparing quotes, the best metric for an apples-to-apples comparison is the cost per watt. Price benchmarking by the National Renewable Energy Laboratory shows the average cost per watt for the nation was $2.65/W DC in 2021, and the average system size was 7.15 kW. So, an average system would cost about $18,950. With 12.5 kWh of battery energy storage, the average cost was $4.26/W, representing an average price tag of $30,460 with batteries included.

The prices above do not include any incentives. Currently, the federal government applies a 26% investment tax credit to the system, bringing down system costs for those who qualify to $14,023 without batteries, and $22,540 with batteries. Compared to the potential $39,460 in utility bills, buying a solar system outright in cash appears to show a clear financial benefit.

Many homeowners will need financing to buy a solar system. Shorter terms can achieve rates as low as 2.99% or less, but financing for a 20-year solar loan typically lands between 5% to 8% or more. Based on 20-year, 7% annual percentage rate terms, a $14,000 system would total about $26,000 in loan payments over 20 years, and the system with batteries included would total about $42,000 in loan payments.

Often when you adopt solar, the utility will still charge you a grid access fee even if your system produces 100% of your needs. These vary from utility to utility but are often around $10 a month. Over 20 years, that equates to about $2,400 that you’ll still need to pay to the utility, plus any costs for energy you use beyond what your system provides.

Based on these average figures, a homeowner could expect to see as much as $12,000 in savings with a 20-year financed system. Homeowners in regions whose retail energy price exceeds the national average could see savings in multiples of that figure.

Though in this example batteries appear to be marginally more expensive than the status quo over a 20-year term, they improve the home by adding the crucial service of backup power, and as battery costs continue to fall they are increasingly being approved to participate in grid services, potentially unlocking additional revenue streams for homeowners.

Another thing to note is most solar systems are warranted for 25 years rather than the 20 used in the status quo example. A panel can last a good 35 years, and though it will begin to produce less in old age, any power produced by a panel you own is money back in your pocket.

Incentives and home value

Many states have additional incentives to boost the value of solar, too, and federal proposals to increase solar generation tenfold could remake the U.S. electricity system. Checking the Database of State Incentives for Renewables (DSIRE) will show the incentives available in your state, and a solar representative should be able to walk you through these benefits when you receive a quote. State incentives change frequently and vary widely, and in some cases are quite rich, offering thousands of dollars in additional benefits.

Another factor to consider is home value. A study by Zillow found that solar arrays increase a home value by 4.1% on average. For a $375,000 home, that’s an increase of $15,375 in value. In most states home solar is exempt from property taxes, making it a great way to boost value without paying taxes for it.

Bottom line

We’ve shared a lot of data on national averages and the potential cost of power going forward, but is solar for you? In the past, early adopters have been rewarded for going solar, and celebrate when they see $0 electric bills paid to the utility company.

Each home is different, each utility is different, and each homeowner has different needs, so evaluating whether solar is right for your home will take a little time and analysis. Representatives from solar companies will walk you through this analysis, and it’s generally a good rule of thumb to get at least three quotes for comparison.

A great resource for starting your research is the Solar Calculator developed by informational site SolarReviews. The calculator offers a quote and savings estimate based on local rates and incentives available to your area. The website also features reviews of installers, equipment, and more.

Some people will save tens of thousands of dollars in the long run with solar, while others may witness more modest savings. Solar will also provide the home clean, local energy, and U.S. solar generation is projected to reach 20% by 2050 as capacity expands, making an impact both on mitigating climate change and in supporting local jobs.

One indisputable benefit of solar is that it will offer greater clarity into what your electricity bills will cost over the next couple of decades, rather than leaving you exposed to whatever rates the utility company decides to charge in the future.


Related News

View more

Sign Up for Electricity Forum’s Newsletter

Stay informed with our FREE Newsletter — get the latest news, breakthrough technologies, and expert insights, delivered straight to your inbox.

Electricity Today T&D Magazine Subscribe for FREE

Stay informed with the latest T&D policies and technologies.
  • Timely insights from industry experts
  • Practical solutions T&D engineers
  • Free access to every issue

Live Online & In-person Group Training

Advantages To Instructor-Led Training – Instructor-Led Course, Customized Training, Multiple Locations, Economical, CEU Credits, Course Discounts.

Request For Quotation

Whether you would prefer Live Online or In-Person instruction, our electrical training courses can be tailored to meet your company's specific requirements and delivered to your employees in one location or at various locations.