Lab and 14 firms team up on lithium battery

By Reuters


CSA Z462 Arc Flash Training - Electrical Safety Essentials

Our customized live online or in‑person group training can be delivered to your staff at your location.

  • Live Online
  • 6 hours Instructor-led
  • Group Training Available
Regular Price:
$249
Coupon Price:
$199
Reserve Your Seat Today
Aiming to mass-produce a lithium battery for vehicles, 14 U.S. companies with expertise in batteries and advanced materials have formed an alliance with a government laboratory, the lab said.

The alliance, which includes battery industry giants such as 3M Co and Johnson Controls-Saft, intends to secure $1 billion to $2 billion in U.S. government funding over the next five years to build a manufacturing facility with an "open foundry" for the participants to pursue the goal of perfecting lithium-ion batteries for cars.

"It's a huge deal for the nation, and for the lab," said Mark Peters, who is in charge of transportation and battery research at Argonne National Laboratory near Chicago, which will advise the group.

China, Japan and South Korea are the current leaders in lithium battery research, he said in a telephone interview.

"A small, fragmented (U.S.) battery industry will not long survive in the face of determined Asian competition," Ralph Brodd, a consultant to battery manufacturers, said in a statement released by Argonne.

"(Other) countries understand that he who makes the batteries will one day make the cars," he said.

The best-selling hybrid vehicles such as Toyota Motor Corp's Prius use a nickel metal hydride battery. Lithium batteries are widely considered to be the next technological leap forward for electric-powered vehicles, as they can be recharged in a wall socket like a computer battery.

The National Alliance for Advanced Transportation Battery Cell Manufacture was modeled after SEMATECH, the successful public-private venture created in the late 1980s to restore U.S. prominence in computer semiconductor technology.

Besides Johnson Controls-Saft Advanced Power Solutions, a joint venture of Johnson Controls Inc and France's Saft Groupe SA, and 3M Co, the founding members of the battery alliance are ActaCell, All Cell Technologies, Altair Nanotechnologies Inc, Eagle Picher Industries Inc, EnerSys, Envia Systems, FMC Corp, MicroSun Technologies, Mobius Power, SiLyte, Superior Graphite, and Townsend Advanced Energy.

In addition to an advisory role for Argonne, U.S. truck and auto makers will be asked to join the alliance's advisory board, said James Greenberger, an attorney who was instrumental in assembling the group.

Related News

Electric shock: China power demand drops as coronavirus shutters plants

China Industrial Power Demand 2020 highlights COVID-19 disruption to electricity consumption as factory output stalls; IHS Markit estimates losses equal to Chile's usage, impacting thermal coal, LNG, and Hubei's industrial load.


Key Points

An analysis of COVID-19's hit to China's electricity use, cutting industry demand and fuel needs for coal and LNG.

✅ 73 billion kWh loss equals Chile's annual power use

✅ Cuts translate to 30m tonnes coal or 9m tonnes LNG

✅ Hubei peak load 21 percent below plan amid shutdowns


China’s industrial power demand in 2020 may decline by as much as 73 billion kilowatt hours (kWh), according to IHS Markit, as the outbreak of the coronavirus has curtailed factory output and prevented some workers from returning to their jobs.

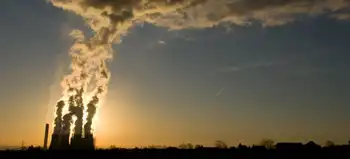
FILE PHOTO: Smoke is seen from a cooling tower of a China Energy ultra-low emission coal-fired power plant during a media tour, in Sanhe, Hebei province, China July 18, 2019. REUTERS/Shivani Singh
The cut represents about 1.5% of industrial power consumption in China. But, as the country is the world’s biggest electricity consumer and analyses of China's electricity appetite routinely underscore its scale, the loss is equal to the power used in the whole of Chile and it illustrates the scope of the disruption caused by the outbreak.

The reduction is the energy equivalent of about 30 million tonnes of thermal coal, at a time when China aims to reduce coal power production, or about 9 million tonnes of liquefied natural gas (LNG), IHS said. The coal figure is more than China’s average monthly imports last year while the LNG figure is a little more than one month of imports, based on customs data.

China has tried to curtail the spread of the coronavirus that has killed more than 1,400 and infected over 60,000 by extending the Lunar New Year holiday for an extra week and encouraging people to work from home, measures that contributed to a global dip in electricity demand as well.

Last year, industrial users consumed 4.85 trillion kWh electricity, accounting for 67% of the country’s total, even as India's electricity demand showed sharp declines in the region.

Xizhou Zhou, the global head of power and Renewables at IHS Markit, said that in a severe case where the epidemic goes on past March, China’s economic growth will be only 4.2% during 2020, down from an initial forecast of 5.8%, while power consumption will climb by only 3.1%, down from 4.1% initially, even as power cuts and blackouts raise concerns.

“The main uncertainty is still how fast the virus will be brought under control,” said Zhou, adding that the impact on the power sector will be relatively modest from a full-year picture in 2020, even though China's electric power woes are already clouding solar markets.

In Hubei province, the epicenter of the virus outbreak, the peak power load at the end of January was 21% less than planned, mirroring how Japan's power demand was hit during the outbreak, data from Wood Mackenzie showed.

Industrial operating rates point to a firm reduction in power consumption in China.

Utilization rates at plastic processors are between 30% and 60% and the low levels are expected to last for another two week, according to ICIS China.

Weaving machines at textile plants are operating at below 10% of capacity, the lowest in five years, ICIS data showed. China is the world’s biggest textile and garment exporter.


Related News

View more

Cost, safety drive line-burying decisions at Tucson Electric Power

TEP Undergrounding Policy prioritizes selective underground power lines to manage wildfire risk, engineering costs, and ratepayer impacts, balancing transmission and distribution reliability with right-of-way, safety, and vegetation management per Arizona regulators.


Key Points

A selective TEP approach to bury lines where safety, engineering, and cost justify undergrounding.

✅ Selective undergrounding for feeders near substations

✅ Balances wildfire mitigation, reliability, and ratepayer costs

✅ Follows ACC rules, BLM and USFS vegetation management


Though wildfires in California caused by power lines have prompted calls for more underground lines, Tucson Electric Power Co. plans to keep to its policy of burying lines selectively for safety.

Like many other utilities, TEP typically doesn’t install its long-range, high-voltage transmission lines, such as the TransWest Express project, and distribution equipment underground because of higher costs that would be passed on to ratepayers, TEP spokesman Joe Barrios said.

But the company will sometimes bury lower-voltage lines and equipment where it is cost-effective or needed for safety as utilities adapt to climate change across North America, or if customers or developers are willing to pay the higher installation costs

Underground installations generally include additional engineering expenses, right-of-way acquisition for projects like the New England Clean Power Link in other regions, and added labor and materials, Barrios said.

“This practice avoids passing along unnecessary costs to customers through their rates, so that all customers are not asked to subsidize a discretionary expenditure that primarily benefits residents or property owners in one small area of our service territory,” he said, adding that the Arizona Corporation Commission has supported the company’s policy.

Even so, TEP will place equipment underground in some circumstances if engineering or safety concerns, including electrical safety tips that utilities promote during storm season, justify the additional cost of underground installation, Barrios said.

In fact, lower-voltage “feeder” lines emerging from distribution substations are typically installed underground until the lines reach a point where they can be safely brought above ground, he added.

While in California PG&E has shut off power during windy weather to avoid wildfires in forested areas traversed by its power lines after events like the Drum Fire last June, TEP doesn’t face the same kind of wildfire risk, Barrios said.

Most of TEP’s 5,000 miles of transmission and distribution lines aren’t located in heavily forested areas that would raise fire concerns, though large urban systems have seen outages after station fires in Los Angeles, he said.

However, TEP has an active program of monitoring transmission lines and trimming vegetation to maintain a fire-safety buffer zone and address risks from vandalism such as copper theft where applicable, in compliance with federal regulations and in cooperation with the U.S. Bureau of Land Management and the U.S. Forest Service.


Related News

View more

California Legislators Prepare Vote to Crack Down on Utility Spending

California Utility Spending Bill scrutinizes how ratepayer funds are used by utilities, targeting lobbying, advertising, wildfire prevention cost pass-throughs, and CPUC oversight to curb high electricity bills and increase accountability and transparency statewide.


Key Points

Legislation restricting utilities from using ratepayer money for lobbying and ads, with stronger CPUC oversight.

✅ Bans ratepayer-funded lobbying and political advertising

✅ Expands prohibited utility communications and influence spending

✅ Aims to curb bills, boost transparency, and CPUC accountability


California's legislators are about to vote on a bill that would impose stricter regulations on how utility companies spend the money they collect from ratepayers. This legislation directly responds to the growing discontent among Californians who are already grappling with high electricity bills, as Californians ask why electricity prices are soaring amid wildfire prevention efforts.

Consumer rights groups have been vehemently critical of how utilities have been allocating customer funds, amid growing calls for regulatory action from state officials. They allege that a substantial portion of this money is being funnelled into lobbying efforts and advertising campaigns that yield no direct benefits for the customers themselves.

The proposed bill would significantly broaden the definition of what constitutes prohibited advertising and political influence activities on the part of utility companies, separate from income-based fixed electricity charges proposals that affect rate design. This would effectively restrict the ways in which utilities can utilize customer funds for such purposes.

While consumer advocacy groups have favored the legislation, it has drawn opposition from utility companies and some labor unions, as lawmakers weigh overturning income-based utility charges in parallel debates. Opponents contend that it would hinder utilities' ability to communicate effectively with their customers and advocate for their interests. Additionally, they express concerns that the bill could result in job losses within the utility sector.

The vote on the bill is expected to take place on Monday. The outcome of the vote is uncertain, but it is sure to be a closely watched development for Californians struggling with the burden of high electricity bills, with many wondering about major changes to their electric bills in the near term.


California's Electricity Rates: A Burden for Residents

A recent report by the California Public Utilities Commission (CPUC) revealed that the average Californian household spends a significantly higher amount on electricity compared to the national average. This disparity in electricity rates can be attributed to a number of factors, including the financial costs associated with wildfire prevention measures, investments in renewable energy infrastructure, and maintenance of aging electrical grids, even as the state considers revamping electricity rates to clean the grid.


Examples of Utility Company Spending that Raise Concerns

Consumer rights groups have specifically highlighted instances where utility companies have used customer money to fund lavish executive compensation packages, sponsor professional sports teams, and finance political campaigns. They argue that these expenditures do not provide any tangible benefits to ratepayers and should not be funded through customer bills.


The Need for Accountability and Prioritization

Proponents of the bill believe that the legislation is necessary to ensure that utility companies are held accountable for how they spend customer funds. They believe that the stricter regulations would compel utilities to prioritize investments that directly improve the quality and reliability of electricity services for Californians, alongside discussions of income-based flat-fee utility bills that could reshape rate structures.

The impending vote on the bill underscores the ongoing tension between the need for reliable electricity services and the desire to keep utility rates affordable for Californians. The outcome of the vote is likely to have a significant impact on how utility companies operate in the state and how much Californians pay for their electricity.


Related News

View more

Here are 3 ways to find out where your electricity comes from

US energy mix shows how the electric grid blends renewables, fossil fuels, nuclear, and hydro, varying by ISO/RTO markets, utilities, and state policies, affecting carbon emissions, pricing, reliability, and access.


Key Points

The US energy mix is the grid's source breakdown by region: fossil fuels, renewables, nuclear, and hydro.

✅ Check ISO or RTO dashboards for real-time generation by fuel source.

✅ Utilities may offer green power plans or RECs at modest premiums.

✅ Energy mix shifts with policy, pricing, and grid reliability needs.


There are few resources more important than energy. Sure, you may die if you don't eat for days. But your phone will die if you go too long without charging it. Energy feeds tech, the internet, city infrastructure, refrigerators, lights, and has evolved throughout U.S. history in profound ways. You get the idea. Yet unlike our other common needs, such as food, energy sources aren't exactly front of mind for most people. 

"I think a lot of people don't put a lot of bandwidth into thinking about this part of their lives," said Richard McMahon, the SVP of energy supply and finance at Edison Electric Institute, a trade group that represents investor-owned electric companies in the US. 

It makes sense. For most Americans, electricity is always there, and in many locations, there's not much of a choice involved, even as electricity demand is flat across the U.S. today. You sign up with a utility when you move into a new residence and pay your bills when they're due. 

But there's an important reality that indifference eschews: In 2018, a third of the energy-related carbon-dioxide emissions in the US came from the electric power sector, according to the US Energy Information Administration (EIA). 

A good chunk of that is from the residential sector, which consistently uses more energy than commercial customers, per EIA data.

Just as many people exercise choice when they eat, you typically also have a choice when it comes to your energy supply. That's not to say your current offering isn't what you want, or that switching will be easy or affordable, but "if you're a customer and want power with a certain attribute," McMahon said, "you can pretty much get it wherever you are." 

But first, you need to know the energy mix you have right now. As it turns out, it's not so straightforward. At all.

This brief guide may help. 

For some utility providers, you can find out if it publishes the energy mix online. Dominion Energy, which serves Idaho, North Carolina, Ohio, South Carolina, Utah, Virginia, West Virginia, and Wyoming, provides this information in a colored graphic. 

"Once you figure out who your utility is you can figure out what mix of resources they use," said Heidi Ratz, an electricity markets researcher at the World Resources Institute.

But not all utilities publish this information.

It has to do with their role in the grid and reflects utility industry trends in structure and markets. Some utility companies are vertically integrated; they generate power through nuclear plants or wind farms and distribute those electrons directly to their customers. Other utilities just distribute the power that different companies produce. 

Consider Consolidated Edison, or Con Ed, which distributes energy to parts of New York City. While reporting this story, Business Insider could not find information about the utility's energy mix online. When reached for comment, a spokesperson said, "we're indifferent to where it comes from."

That's because, in New York, distribution utilities like Con Ed often buy energy through a wholesale marketplace.

Take a look at this map. If you live in one of the colored regions, your electricity is sold on a wholesale market regulated by an organization called a regional transmission organization (RTO) or independent system operator (ISO). Distribution utilities like Con Ed often buy their energy through these markets, based on availability and cost, while raising questions about future utility revenue models as prices shift. 

Still, it's pretty easy to figure out where your energy comes from. Just look up the ISO or RTO website (such as NYISO or CAISO). Usually, these organizations will provide energy supply information in near-real time. 

That's exactly what Con Edison (which buys energy on the NYISO marketplace) suggested. As of Friday morning, roughly 40% of the energy on the market place was natural gas or other fossil fuels, 34% was nuclear, and about 22% was hydro. 

If you live in another region governed by an ISO or RTO, such as in most of California, you can do the same thing. Like NYISO, CAISO has a dashboard that shows (again, as of Friday morning) about 36% of the energy on the market comes from natural gas and more than 20% comes from renewables. 

In the map linked above, you'll notice that some of the ISOs and RTOs like MISO encompass enormous regions. That means that even if you figure out where the energy in your market comes from, it's not going to be geographically specific. But there are a couple of ways to drill down even further. 

The Environmental Protection Agency has a straightforward tool called Power Profiler. You can enter your zip code to see the fuel mix in your area. But it's not perfect. The data are from 2016 and, in some regions of the country like the upper Midwest, they aren't much more localized, and some import dirty electricity due to regional trading. 

The World Resources Institute also has a tool that allows you to see the electricity mix by state, based on 2017 data from EIA. These numbers represent power generation, not the electricity actually flowing into your sockets, but they offer a rough idea of what energy resources are operating in your state. 

One option is to check with your utility to see if it has a "green power" offering. Over 600 utilities across the country have one, according to the Climate Reality Project, though they often come at a slightly higher cost. It's typically on the scale of just a few more cents per kilowatt-hour. 

There are also independent, consumer-facing companies like Arcadia and Green Mountain Energy that allow you to source renewable energy, by virtually connecting you to community solar projects or purchasing Renewable Energy Certificates, or RECs, on your behalf, as America goes electric and more options emerge. 

"RECs measure an investment in a clean energy resource," Ratz said, in an email. "The goal of putting that resource on the grid is to push out the need for dirtier resources."

The good news: Even if you do nothing, your energy mix will get cleaner. Coal production has fallen to lows not seen since the 1980s, amid disruptions in coal and nuclear sectors that affect reliability and costs, while renewable electricity generation has doubled since 2008. So whether you like it or not, you'll be roped into the clean energy boom one way or another. 


Related News

View more

Japan's power demand hit by coronavirus outbreak: industry head

Japan Power Demand Slowdown highlights reduced electricity consumption as industrial activity stalls amid the coronavirus pandemic, pressuring utilities, the grid, and manufacturing, with economic impacts monitored by Chubu Electric and the federation of electric utilities.


Key Points

A drop in Japan's electricity use as industrial activity slows during the coronavirus pandemic, pressuring utilities.

✅ Industrial slowdown cuts electricity consumption

✅ Utilities monitor grid stability and demand trends

✅ Pandemic-linked economic risks weigh on power sector


Japan's power demand has been hit by a slowdown in industrial activity due to the coronavirus outbreak, reflecting broader shifts in electricity demand worldwide, Japanese utilities federation's head said on Friday, without giving specific figures.

Electricity load profiles during lockdowns revealed changes in daily routines, as shown by lockdown electricity data across multiple regions.

Analysts have identified key shifts in U.S. electricity consumption patterns that mirror industrial slowdowns.

"We are closely watching development of the pandemic, underscoring the need for electricity during such crises, as further reduction in corporate and economic activities would lead to serious impacts," Satoru Katsuno, the chairman of Japan's federation of electric utilities and president of Chubu Electric Power Co Inc, told a news conference.

In parallel, the power industry has intensified coordination with federal partners to sustain grid reliability and protect critical workers.

Some governments, including Brazil, considered emergency loans for the power sector to stabilize utilities amid revenue pressures.

Consumer advocates warned that pandemic-related electricity shut-offs and bill burdens could exacerbate energy insecurity for vulnerable households.


Related News

View more

Idaho gets vast majority of electricity from renewables, almost half from hydropower

Idaho Renewable Energy 2018 saw over 80% in-state utility-scale power from hydropower, wind, solar, biomass, and geothermal, per EIA, with imports declining as Snake River Plain resources and Hells Canyon hydro lead.


Key Points

Idaho produced over 80% in-state power from renewables in 2018, led by hydropower, wind, solar, and biomass.

✅ Hydropower supplies about half of capacity; Hells Canyon leads.

✅ Wind provides nearly 20% of capacity along the Snake River Plain.

✅ Utility-scale solar surged since 2016; biomass and geothermal add output.


More than 80% of Idaho’s in-state utility-scale electricity generation came from renewable resources in 2018, behind only Vermont, according to recently released data from the U.S. Energy Information Administration’s Electric Power Monthly and broader trends showing that solar and wind reached about 10% of U.S. generation in the first half of 2018.

Idaho generated 17.4 million MWh of electricity in 2018, of which 14.2 million MWh came from renewable sources, while nationally January power generation jumped 9.3% year over year according to EIA. Idaho uses a variety of renewable resources to generate electricity:

Hydroelectricity. Idaho ranked seventh in the U.S. in electricity generation from hydropower in 2018. About half of Idaho’s electricity generating capacity is at hydroelectric power plants, and utility actions such as the Idaho Power settlement could influence future resource choices, and seven of the state’s 10 largest power plants (in terms of electricity generation) are hydroelectric facilities. The largest privately owned hydroelectric generating facility in the U.S. is a three-dam complex on the Snake River in Hells Canyon, the deepest river gorge in North America.

Wind. Nearly one-fifth of Idaho’s electricity generating capacity and one-sixth of its generation comes from wind turbines. Idaho has substantial wind energy potential, and nationally the EIA expects solar and wind to be larger sources this summer, although only a small percentage of the state's land area is well-suited for wind development. All of the state’s wind farms are located in the southern half of the state along the Snake River Plain.

Solar. Almost 5% of Idaho’s electricity generating capacity and 3% of its generation come from utility-scale solar facilities, and nationally over half of new capacity in 2023 will be solar according to projections. The state had no utility-scale solar generation as recently as 2015. Between 2016 and 2017, Idaho’s utility-scale capacity doubled and generation increased from 30,000 MWh to more than 450,000 MWh. Idaho’s small-scale solar capacity also doubled since 2017, generating 33,000 MWh in 2018.

Biomass. Biomass-fueled power plants account for about 2% of the state’s utility-scale electricity generating capacity and 3% of its generation, contributing to a broader U.S. shift where 40% of electricity came from non-fossil sources in 2021. Wood waste from the state’s forests is the primary fuel for these plants.

Geothermal. Idaho is one of seven states with utility-scale geothermal electricity generation. Idaho has one 18-MW geothermal facility, located near the state’s southern border with Utah.

EIA says Idaho requires significant electricity imports, totaling about one-third of demand, to meet its electricity needs. However, Idaho’s electricity imports have decreased over time, and Georgia's recent import levels illustrate how regional dynamics can vary. Almost all of these imports are from neighboring states, as electricity imports from Canada accounted for less than 0.1% of Idaho’s total electricity supply in 2017.


Related News

View more

Sign Up for Electricity Forum’s Newsletter

Stay informed with our FREE Newsletter — get the latest news, breakthrough technologies, and expert insights, delivered straight to your inbox.

Electricity Today T&D Magazine Subscribe for FREE

Stay informed with the latest T&D policies and technologies.
  • Timely insights from industry experts
  • Practical solutions T&D engineers
  • Free access to every issue

Download the 2025 Electrical Training Catalog

Explore 50+ live, expert-led electrical training courses –

  • Interactive
  • Flexible
  • CEU-cerified