Ontario looks to build on electricity deal with Quebec


ontario quebec power lines

CSA Z462 Arc Flash Training - Electrical Safety Essentials

Our customized live online or in‑person group training can be delivered to your staff at your location.

  • Live Online
  • 6 hours Instructor-led
  • Group Training Available
Regular Price:
$249
Coupon Price:
$199
Reserve Your Seat Today

Ontario-Quebec Electricity Deal explores hydro imports, terawatt hours, electricity costs, greenhouse gas cuts, and baseload impacts, amid debates on Pickering nuclear operations and competitive procurement in Ontario's long-term energy planning.


Key Points

A proposed hydro import deal from Quebec, balancing costs, emissions, and reliability for Ontario electricity customers.

✅ Draft 20-year, 8 TWh offer reported by La Presse disputed

✅ Ontario seeks lower costs and GHG cuts versus alternatives

✅ Not a baseload replacement; Pickering closure not planned


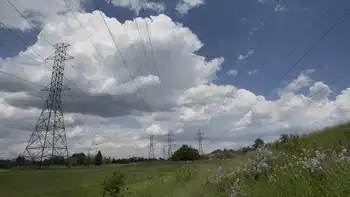
Ontario is negotiating a possible energy swap agreement to buy electricity from Quebec, but the government is disputing a published report that it is preparing to sign a deal for enough electricity to power a city the size of Ottawa.

La Presse reported Tuesday that it obtained a copy of a draft, 20-year deal that says Ontario would buy eight terawatt hours a year from Quebec – about 6 per cent of Ontario’s consumption – whether the electricity is consumed or not.

Ontario Energy Minister Glenn Thibeault’s office said the province is in discussions to build on an agreement signed last year for Ontario to import up to two terawatt hours of electricity a year from Quebec.


But his office released a letter dated late last month to his Quebec counterpart, in which Mr. Thibeault said the offer extended in June was unacceptable because it would increase the average residential electricity bill by $30 a year.

“I am hopeful that your continued support and efforts will help to further discussions between our jurisdictions that could lead to an agreement that is in the best interest of both Ontario and Quebec,” Mr. Thibeault wrote July 27 to Pierre Arcand.

Ontario would prepare a “term sheet” for the next stage of discussions ahead of the two ministers meeting at the Energy and Mines Ministers Conference later this month in New Brunswick, Mr. Thibeault wrote.

Any future agreements with Quebec will have to provide a reduction in Ontario electricity rates compared with other alternatives and demonstrate measurable reductions in greenhouse gas emissions, he wrote.

Progressive Conservative Leader Patrick Brown said Ontario doesn’t need eight terawatt hours of additional power and suggested it means the Liberal government is considering closing power facilities such as the Pickering nuclear plant early.

A senior Energy Ministry official said that is not on the table. The government has said it intends to keep operating two units at Pickering until 2022, and the other four units until 2024.

Even if the Quebec offer had been accepted, the energy official said, that power wouldn’t have replaced any of Ontario’s baseload power because it couldn’t have been counted on 24 hours a day, 365 days a year.

The Society of Energy Professionals said Mr. Thibeault was right to reject the deal, but called on him to release the Long-Term Energy Plan – which was supposed to be out this spring – before continuing negotiations.

Some commentators have argued for broader reforms to address Ontario's hydro system challenges, urging policymakers to review all options as negotiations proceed.

The Ontario Energy Association said the reported deal would run counter to the government’s stated energy objectives amid concerns over electricity prices in the province.

“Ontarians will not get the benefit of competition to ensure it is the best of all possible options for the province, and companies who have invested in Ontario and have employees here will not get the opportunity to provide alternatives,” president and chief executive Vince Brescia said in a statement. “Competitive processes should be used for any new significant system capacity in Ontario.”

The Association of Power Producers of Ontario said it is concerned the government is even considering deals that would “threaten to undercut a competitive marketplace and long-term planning.”

“Ontario already has a surplus of energy, so it’s very difficult to see how this deal or any other sole-source deal with Quebec could benefit the province and its ratepayers,” association president and CEO David Butters said in a statement.

The Ontario Waterpower Association also said such a deal with Quebec would “present a significant challenge to continued investment in waterpower in Ontario.”


Related News

Related News

Illinois electric utility publishes online map of potential solar capacity

ComEd Hosting Capacity Map helps Illinois communities assess photovoltaic capacity, distributed energy resources, interconnection limits, and grid planning needs, guiding developers and policymakers on siting solar, net metering feasibility, and RPS-aligned deployment by circuit.


Key Points

An online tool showing circuit-level DER capacity, PV limits, and interconnection readiness across ComEd.

✅ Circuit-level estimates of solar hosting capacity

✅ Guides siting, interconnection, and net metering

✅ Supports RPS goals with grid planning insights


As the Illinois solar market grows from the Future Energy Jobs Act, the largest utility in the state has posted a planning tool to identify potential PV capacity in their service territory. ComEd, a Northern Illinois subsidiary of Exelon, has a hosting capacity website for its communities indicating how much photovoltaic capacity can be sited in given areas, based on the existing electrical infrastructure, as utilities pilot virtual power plant programs that leverage distributed resources.

According to ComEd’s description, “Hosting Capacity is an estimate of the amount of DER [distributed energy resources] that may be accommodated under current configurations at the overall circuit level without significant system upgrades to address adverse impacts to power quality or reliability.” This website will enable developers and local decision makers to estimate how much solar could be installed by township, sections and fractions of sections as small as ½ mile by ½ mile and to gauge EV charging impacts with NREL's projection tool for distribution planning. The map sections indicate potential capacity by AC kilowatts with a link to to ComEd’s recently upgraded Interconnection and Net Metering homepage.

The Hosting Map can provide insight into how much solar can be installed in which locations in order to help solar reach a significant portion of the Illinois Renewable Portfolio Standard (RPS) of 25% electricity from renewable sources by 2025, and to plan for transportation electrification as EV charging infrastructure scales across utility territories. For example, the 18 sections of Oak Park Township capacity range from 612 to 909 kW, and total 13,260 kW of photovoltaic power. That could potentially generate around 20 million kWh, and policy actions such as the CPUC-approved PG&E EV program illustrate how electrification initiatives may influence future demand. Oak Park, according to the PlanItGreen Report Card, a joint project of the Oak Park River Forest Community Foundation and Seven Generations Ahead, uses about 325 million kWh.

Based on ComEd’s Hosting Capacity, Oak Park could generate about 6% of its electricity from solar power located within its borders. Going significantly beyond this amount would likely require a combination of upgrades by ComEd’s infrastructure, potentially higher interconnection costs and deployment of technologies like energy storage solutions. What this does indicate is that a densely populated community like Oak Park would most likely have to get the majority of its solar and renewable electricity from outside its boundaries to reach the statewide RPS goal of 25%. The Hosting Capacity Map shows a considerable disparity among communities in ½ mile by ½ mile sections with some able to host only 100-200 kWs to some with capacities of over 3,000 kW.


Related News

View more

Why Is Georgia Importing So Much Electricity?

Georgia Electricity Imports October 2017 surged as hydropower output fell and thermal power plants underperformed; ESCO balanced demand via low-cost imports, mainly from Azerbaijan, amid rising tariffs, kWh consumption growth, and a widening generation-consumption gap.


Key Points

They mark a record import surge due to costly local generation, lower hydropower, ESCO balancing costs, and rising demand.

✅ Imports rose 832% YoY to 157 mln kWh, mainly from Azerbaijan

✅ TPP output fell despite capacity; only low-tariff plants ran

✅ Balancing price 13.8 tetri/kWh signaled costly domestic PPAs


In October 2017, Georgian power plants generated 828 mln. KWh of electricity, marginally up (+0.79%) compared to September. Following the traditional seasonal pattern and amid European concerns over dispatchable power shortages affecting markets, the share of electricity produced by renewable sources declined to 71% of total generation (87% in September), while thermal power generation’s share increased, accounting for 29% of total generation (compared to 13% in September). When we compare last October’s total generation with the total generation of October 2016, however, we observe an 8.7% decrease in total generation (in October 2016, total generation was 907 mln. kWh). The overall decline in generation with respect to the previous year is due to a simultaneous decline in both thermal power and hydro power generation. 

Consumption of electricity on the local market in the same period was 949 mln. kWh (+7% compared to October 2016, and +3% with respect to September 2017), and reflected global trends such as India's electricity growth in recent years. The gap between consumption and generation increased to 121 mln. kWh (15% of the amount generated in October), up from 100 mln. kWh in September. Even more importantly, the situation was radically different with respect to the prior year, when generation exceeded consumption.

The import figure for October was by far the highest from the last 12 years (since ESCO was established), occurring as Ukraine electricity exports resumed regionally, highlighting wider cross-border dynamics. In October 2017, Georgia imported 157 mln. kWh of electricity (for 5.2 ¢/kWh – 13 tetri/kWh). This constituted an 832% increase compared to October 2016, and is about 50% larger than the second largest import figure (104.2 mln. kWh in October 2014). Most of the October 2017 imports (99.6%) came from Azerbaijan, with the remaining 0.04% coming from Russia.

The main question that comes to mind when observing these statistics is: why did Georgia import so much? One might argue that this is just the result of a bad year for hydropower generation and increased demand. This argument, however, is not fully convincing. While it is true that hydropower generation declined and demand increased, the country’s excess demand could have been easily satisfied by its existing thermal power plants, even as imported coal volumes rose in regional markets. Instead of increasing, however, the electricity coming from thermal power plants declined as well. Therefore, that cannot be the reason, and another must be found. The first that comes to mind is that importing electricity may have been cheaper than buying it from local TPPs, or from other generators selling electricity to ESCO under power purchase agreements (PPAs). We can test the first part of this hypothesis by comparing the average price of imported electricity to the price ceiling on the tariff that TPPs can charge for the electricity they sell. Looking at the trade statistics from Geostat, the average price for imported electricity in October 2017 remained stable with respect to the same month of the previous year, at 5.2 ¢ (13 tetri) per kWh. Only two thermal power plants (Gardabani and Mtkvari) had a price ceiling below 13 tetri per kWh. Observing the electricity balance of Georgia, we see that indeed more than 98% of the electricity generated by TPPs in October 2017 was generated by those two power plants.

What about other potential sources of electricity amid Central Asia's power shortages at the time? To answer this question, we can use the information derived from the weighted average price of balancing electricity. Why balancing electricity? Because it allows us to reconstruct the costs the market operator (ESCO) faced during the month of October to make sure demand and supply were balanced, and it allows us to gain an insight about the price of electricity sold through PPAs.

ESCO reports that the weighted average price of balancing electricity in October 2017 was 13.8 tetri/kWh, (25% higher than in October 2016, when it was below the average weighted cost of imports – 11 vs. 13 – and when the quantity of imported electricity was substantially smaller). Knowing that in October 2017, 61% of balancing electricity came from imports, while 39% came from hydropower and wind power plants selling electricity to ESCO under their PPAs, we can deduce that in this case, internal generation was (on average) also substantially more expensive than imports. Therefore, the high cost of internally generated electricity, rather than the technical impossibility of generating enough electricity to satisfy electricity demand, indeed appears to be one the main reasons why electricity imports spiked in October 2017.


Related News

View more

Opinion: Would we use Site C's electricity?

Site C Dam Electricity Demand underscores B.C.'s decarbonization path, enabling electrification of EVs, heat pumps, and industry, aligning with BC Hydro forecasts and 2030/2050 GHG targets to supply dependable, renewable baseload power.


Key Points

Projected clean power tied to Site C, driven by B.C. electrification to meet 2030 and 2050 greenhouse gas targets.

✅ Aligns with 25-30% by 2030 and 55-70% by 2050 GHG cuts

✅ Supports EVs, heat pumps, and industrial electrification

✅ Provides dependable baseload alongside efficiency gains


There are valid reasons not to build the Site C dam. There are also valid reasons to build it. One of the latter is the rapid increase in clean electricity needed to reduce B.C.’s greenhouse gas emissions from burning natural gas, gasoline, diesel and other harmful fossil fuel products.

Although former Premier Christy Clark casually avoided near-term emissions targets, Prime Minister Justin Trudeau has set Canadian targets for both 2030 and 2050, and cleaning up Canada's electricity is critical to meeting them. Studies by my research group at Simon Fraser University and other independent analysts show that B.C.’s cost-effective contribution to these national targets requires us to reduce our emissions 25 to 30 per cent by 2030 and 55 to 70 per cent by 2050 — an energy evolution involving, among other things, a much greater use of electricity in buildings, vehicles and industry.

Recent submissions to the Site C hearing have offered widely different estimates of B.C.’s electricity demand in the decade after the project’s completion in 2025, some arguing the dam’s output will be completely surplus to domestic need for years and perhaps decades, even though improved B.C.-Alberta grid links could help balance regional demand. Some of this variation in demand forecasts is understandable. Industrial demand is especially difficult to predict, dependent as it is on global economic conditions and shifting trade relations. And there are legitimate uncertainties about B.C. Hydro’s ability to reduce electricity demand by promoting efficient products and behaviour through its Power Smart program. But some of the forecasts appear to be deliberate exaggerations, designed to support fixed positions for or against Site C.

Our university-based research team models the energy system changes required to meet national and provincial emissions targets, and we have been comparing estimates of the electricity demand implications. These estimates are produced by academics, as well as by key institutions like B.C. Hydro, the National Energy Board, and the governments of Canada and B.C.

Most electricity forecasts for B.C., including the most recent by B.C. Hydro, do not assume that B.C. reduces its greenhouse gas emissions by 25 to 30 per cent by 2030 and 55 to 70 per cent by 2050. When we adjust Hydro’s forecast for just the low end of these targets, we find that in its latest, August 30, submission to the Site C hearing, which followed the premier’s over-budget go-ahead on the project, Hydro has underestimated the demand for its electricity by about three terawatt-hours in 2025, four in 2030 and 10 in 2035. Hydro’s forecast indicates that it will need the five terawatt-hours from Site C. Our research shows that even if Hydro’s demand forecast is too high, appropriate climate policy nationally and in B.C. will absorb all the electricity the dam can produce soon after its completion.

B.C. Hydro does not forecast electricity demand to 2050. But, studies by us and others show that B.C. electricity demand will be almost double today’s levels if we are to reduce emissions by 55 to 70 per cent, even amid a documented risk of missing the 2050 target, in just over three decades while our population, economy, buildings and equipment grow significantly. Most mid- and small-sized vehicles will be electric. Most buildings will be well insulated and heated by electric resistance or electric heat-pumps, either individually or via district heating systems. And many low temperature industrial applications will be electric.

Aggressive efforts to promote energy efficiency will make an important contribution, such that energy demand will not grow nearly as fast as the economy. But it is delusional to think that humans will stop using energy. Even climate policy scenarios in which we assume unprecedented success with energy efficiency show dramatic increases in the consumption of electricity, this being the most favoured zero-emission form of energy as a replacement for planet-destroying gasoline and natural gas.

The completion of the Site C dam is a complicated and challenging societal choice, and delay-related cost risks highlighted by the premier underscore the stakes. There is unbiased evidence and argument supporting either completion or cancellation. But let’s stick to the unbiased evidence. In the case of our 2030 and 2050 greenhouse gas reduction targets, such evidence shows that we must substantially increase our generation of dependable electricity. If the Site C dam is built, and if we are true to our climate goals, all its electricity will be used in B.C. soon after completion.

Mark Jaccard is a professor of sustainable energy in the School of Resource and Environmental Management at Simon Fraser University.


Related News

View more

UK Electricity prices hit 10-year high as cheap wind power wanes

UK Electricity Price Surge driven by wholesale gas costs, low wind output, and higher gas-fired generation, as National Grid boosts base load power to meet demand, lifting weekend prices toward decade highs.


Key Points

A sharp rise in UK power prices tied to gas spikes, waning wind, and higher reliance on gas-fired generation.

✅ Wholesale gas prices squeeze power, doubling weekend baseload.

✅ Wind generation falls to 3GW, forcing more gas-fired plants.

✅ Tariff hikes signal bill pressure and supplier strain.


The UK’s electricity market has followed the lead of surging wholesale gas prices this week to reach weekend highs, with UK peak power prices not seen in a decade across the market.

The power market has avoided the severe volatility which ripped through the gas market this week because strong winds helped to supply ample electricity to meet demand, reflecting recent record wind generation across the UK.

But as freezing winds begin to wane this weekend National Grid will need to use more gas-fired power plants to fill the gap, meaning the cost of generating electricity will surge.

Jamie Stewart, an energy expert at ICIS, said the price for base load power this weekend has already soared to around £80 per megawatt hour, almost double what one would expect to see for a weekend in March.

National Grid will increase its use of expensive gas-fired power by an extra 7GW to make up for low wind power, which is forecast to drop by two-thirds in the days ahead.

Wind speeds helped to protect the electricity system from huge price hikes on the neighbouring gas market on Thursday, by generating as much as 13GW by some estimates.

However, by the end of Friday this output will fall by almost half to 7GW and slump to lows of 3GW by Saturday, Mr Stewart said.

The power price was already higher than usual at £53/MWh last weekend even before the full force of the storms, including Storm Malik wind generation, hit Britain. That was still well above the more typical "mid-40s” price for this time of year, Mr Stewart added.

The twin price spikes across the UK’s energy markets has raised fears of household bill hikes in the months ahead, even as an emergency energy plan is not going ahead.

Late on Thursday Big Six supplier E.on quietly pushed through a dual-fuel tariff increase of 2.6%, to drive the average bill up to £1,153 from 19 April.

Energy supply minnow Bulb also increased prices by £24 a year for its 300,000 customers, blaming rising wholesale costs.

The UK has suffered two gas price shocks this winter, which is the first since the owner of British Gas shuttered the country’s largest gas storage facility at Rough off the Yorkshire coast.

A string of gas supply outages this week cut supplies to the UK just as freezing conditions drove demand for gas-heating a third higher than normal for this time of year.

It was the first time in almost ten years that National Grid was forced to issue a short supply warning to the market that supplies would fall short of demand unless factories agree to use less.

The twelve-year market price highs followed a pre-Christmas spike when the UK’s most important North Sea pipeline shut down at the same time as a deadly explosion at Europe’s most important gas hub, based in the Austrian town of Baumgarten.


Related News

View more

New York Achieves Solar Energy Goals Ahead of Schedule

New York Solar Milestone accelerates renewable energy adoption, meeting targets early with 8,000 MW capacity powering 1.1 million homes, boosting green jobs, community solar, battery storage, and grid reliability under the CLCPA clean energy framework.


Key Points

It is New York achieving its solar goal early, powering 1.1M homes and advancing CLCPA renewable targets.

✅ 8,000 MW installed, enough to power about 1.1M homes

✅ CLCPA targets: 70 percent renewables by 2030

✅ Community solar, storage, and green jobs scaling statewide


In a remarkable display of commitment to renewable energy, New York has achieved its solar energy targets a year ahead of schedule, marking a significant milestone in the state's clean energy journey, and aligning with a national trend where renewables reached a record 28% in April nationwide. With the addition of solar power capacity capable of powering over a million homes, New York is not just setting the pace for solar adoption but is also establishing itself as a leader in the fight against climate change.

A Commitment to Renewable Energy

New York’s ambitious clean energy agenda is part of a broader effort to reduce greenhouse gas emissions and transition to sustainable energy sources. The state's goal, established under the Climate Leadership and Community Protection Act (CLCPA), aims for 70% of its electricity to come from renewable sources by 2030. With the recent advancements in solar energy, including contracts for 23 renewable projects totaling 2.3 GW, New York is well on its way to achieving that goal, demonstrating that aggressive policy frameworks can lead to tangible results.

The Numbers Speak for Themselves

As of now, New York has successfully installed more than 8,000 megawatts (MW) of solar energy capacity, supported by large-scale energy projects underway across New York that are expanding the grid. This achievement translates to enough electricity to power approximately 1.1 million homes, showcasing the state's investment in harnessing the sun’s power. The rapid expansion of solar installations reflects both increasing consumer interest and supportive policies that facilitate growth in the renewable energy sector.

Economic Benefits and Job Creation

The surge in solar energy capacity has not only environmental implications but also significant economic benefits. The solar industry in New York has become a substantial job creator, employing tens of thousands of individuals across various sectors. From manufacturing solar panels to installation and maintenance, the job opportunities associated with this growth are diverse and vital for local economies.

Moreover, as solar installations increase, the state benefits from reduced electricity costs over time. By investing in renewable energy, New York is paving the way for a more resilient and sustainable energy future, while simultaneously providing economic opportunities for its residents.

Community Engagement and Accessibility

New York's solar success is also tied to its efforts to engage communities and increase access to renewable energy. Initiatives such as community solar programs allow residents who may not have the means or space to install solar panels on their homes to benefit from solar energy. These programs provide an inclusive approach, ensuring that low-income households and underserved communities have access to clean energy solutions.

The state has also implemented various incentives to encourage solar adoption, including tax credits, rebates, and financing options. These efforts not only promote environmental sustainability but also aim to make solar energy more accessible to all New Yorkers, furthering the commitment to equity in the energy transition.

Innovations and Future Prospects

New York's solar achievements are complemented by ongoing innovations in technology and energy storage solutions. The integration of battery storage systems is becoming increasingly important, reflecting growth in solar and storage in the coming years, and allowing for the capture and storage of solar energy for use during non-sunny periods. This technology enhances grid reliability and supports the state’s goal of transitioning to a fully sustainable energy system.

Looking ahead, New York aims to continue this momentum. The state is exploring additional strategies to increase renewable energy capacity, including plans to investigate sites for offshore wind across its coastline, and other clean energy technologies. By diversifying its renewable energy portfolio, New York is positioning itself to meet and even exceed future energy demands while reducing its carbon footprint.

A Model for Other States

New York’s success story serves as a model for other states aiming to enhance their renewable energy capabilities, with its approval of the biggest offshore wind farm underscoring that leadership. The combination of strong policy frameworks, community engagement, and technological innovation can inspire similar initiatives nationwide. As more states look to address climate change, New York’s proactive approach can provide valuable insights into effective strategies for solar energy deployment.

New York’s achievement of its solar energy goals a year ahead of schedule is a testament to the state's unwavering commitment to sustainability and renewable energy. With the capacity to power over a million homes, this milestone not only signifies progress in clean energy adoption but also highlights the potential for economic growth and community engagement. As New York continues on its path toward a greener future, and stays on the road to 100% renewables by mid-century, it sets a powerful example for others to follow, proving that ambitious renewable energy goals can indeed become a reality.


Related News

View more

Dutch produce more green electricity but target still a long way off

Netherlands renewable energy progress highlights rising wind energy and solar power output, delivering 17 billion kWh of green electricity from sustainable sources, yet trailing EU targets, with wind providing 60% and solar 34%.


Key Points

It is the country's growth in green electricity, led by wind and solar, yet short of EU targets at 13.8% of generation.

✅ 17 billion kWh green output; 13.8% of total generation

✅ Wind energy up 16% to 9.6 billion kWh; 60% of green power

✅ Solar power up about 13%; 34% of renewable production


The Netherlands is generating more electricity from sustainable sources as US renewable record 28% in April underscores broader momentum but is still far from reaching its targets, the national statistics office CBS said on Friday.

In total, the Netherlands produced 17 billion kilowatts of green energy last year, a rise of 10% on 2016. Sustainable sources now account for 13.8 per cent of energy generation, even as solar reshapes prices in Northern Europe across the region.

The biggest growth was in wind energy – up 16 per cent to 9.6 billion kWh – or the equivalent of energy for three million households. Wind energy now accounts for 60 per cent of green Dutch power. The amount of solar power, which accounts for 34% of green energy production, rose almost 13 per cent, and Dutch solar outpaces Canada according to recent reports.

In January, European statistics agency Eurostat said the Netherlands is near the bottom of a new table on renewable energy use in Europe. The EU has a target of a fifth of all energy use from green sources by 2020 and – while some countries have reached their own targets, including Germany's 50% clean power milestones – the Dutch, French and Irish need to increase their rates by at least 6%, Eurostat said, and Ireland has set green electricity goals for the next four years to close the gap.


Related News

View more

Sign Up for Electricity Forum’s Newsletter

Stay informed with our FREE Newsletter — get the latest news, breakthrough technologies, and expert insights, delivered straight to your inbox.

Electricity Today T&D Magazine Subscribe for FREE

Stay informed with the latest T&D policies and technologies.
  • Timely insights from industry experts
  • Practical solutions T&D engineers
  • Free access to every issue

Live Online & In-person Group Training

Advantages To Instructor-Led Training – Instructor-Led Course, Customized Training, Multiple Locations, Economical, CEU Credits, Course Discounts.

Request For Quotation

Whether you would prefer Live Online or In-Person instruction, our electrical training courses can be tailored to meet your company's specific requirements and delivered to your employees in one location or at various locations.