Electrical Commissioning In Industrial Power Systems
Our customized live online or in‑person group training can be delivered to your staff at your location.

- Live Online
- 12 hours Instructor-led
- Group Training Available
Regular Price:
$599
Coupon Price:
$499
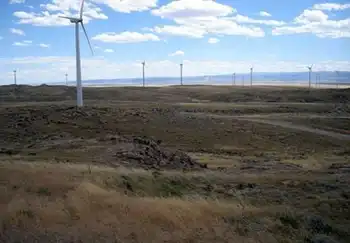
An attitude adjustment by Canadian governments could lead to $132 billion in new wind energy investment by 2025, says a new report from the Canadian Wind Energy Association.
The report released in Vancouver at the CanWEA annual conference and trade show said cheap power from hydro and coal, and a lack of interest by government, are choking the growth of wind power compared to other developed countries.
The report, titled Wind Vision, says European nations in particular are pricing in the cost of environmental impacts when they determine energy costs.
Canada is not making a similar effort, with the consequence that green energy resources such as wind are less competitive than they would be if environmental costs were factored in, the report says.
Canada ranks 16th in the world in terms of installed wind power capacity - and although its installed capacity grew 500 per cent between 2003 and 2008, wind power in leading European nations and the United States grew much faster, the report says.
CanWEA says that with effective policies and incentives by Canadian federal and provincial governments, wind energy could attract enough investment for 55,000 megawatts of wind energy capacity by 2025.
That's five times the installed capacity of BC Hydro's well-established network of hydroelectric generating stations - although the Hydro network provides steady or "firm" power while the electricity generated from wind is intermittent in character.
"It sounds like a big number - it is a big number," said CanWEA president Robert Horning at the conference. "But we are going to be investing hundreds of billions of dollars [anyway] in new electricity generation and transmission infrastructure over the next two decades - remember that we haven't had significant investment in these sectors for a long time."
Hornung said it would take 20,000 turbines to generate 55,000 megawatts of power. He said that would mean development of 450 "average" 50 megawatt wind farms encompassing an area of Canada the size of Prince Edward Island.
The report says neither Ottawa nor the provinces have "acted as forcefully as governments in other countries to encourage investment in wind power and other emerging renewable energy technologies. So, it's no surprise that we trail much of the world in terms of wind power generation." Wind accounts for one per cent of generation capacity in Canada at present - compared to projections by European wind producers that the sector could account for 25-30 per cent of capacity in leading proponent nations such as Germany and Spain.
Wind power is booming in the United States - where producers get a 2.1-cent-per-kilowatt-hour after-tax subsidy.
In Canada, it's a one cent per kilowatt hour pre-tax subsidy, and CanWEA said that's only 40 per cent of the U.S. benefit.
Wind proponents here also face boom-bust cycles in which they respond to calls for power by utilities such as BC Hydro - but may have to wait three years for another chance if they don't make the call, or take their money elsewhere.
At the conference, CanWEA board chair Joyce McLean said there are no technical obstacles to integrating large amounts of wind power onto Canadian power grids.
"There are only policy barriers," McLean said.
The association also released a poll reporting 67 per cent of Canadians believe all new electricity demand should be derived from renewable energy, and that 65 per cent of Canadians say they are willing to pay a higher amount for electricity from renewable sources.
The poll by Strategic Council involved 1,000 randomly selected households across Canada and is considered accurate to 3.1 percentage points 19 times out of 20.
Related News
Smart grid and system improvements help avoid more than 500,000 outages over the summer
ComEd Smart Grid Reliability drives outage reduction across Illinois, leveraging smart switches, grid modernization, and…
View more

Canadian power crews head to Irma-hit Florida to help restore service
Canadian Power Crews Aid Florida after Hurricane Irma, supporting power restoration for Tampa Electric and…
View more
Germany’s renewable energy dreams derailed by cheap Russian gas, electricity grid expansion woes
Germany Energy Transition faces offshore wind expansion, grid bottlenecks, and North-South transmission delays, while Nord…
View more
Midwest Communities Press State Lawmakers to Limit Data Center T&D Burdens
Midwest Data Center Regulation accelerates as counties adopt moratoria and state lawmakers weigh measures to…
View more
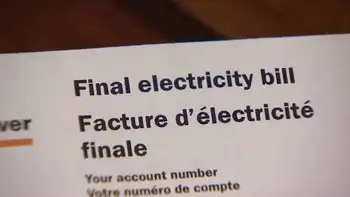
Hundreds facing hydro disconnection as bills pile up during winter ban
Ontario Hydro Disconnection Ban ends May 1, prompting utilities and Hydro One to push payment…
View more
Ottawa Launches Sewage Energy Project at LeBreton Flats
Ottawa Sewage Energy Exchange System uses wastewater heat recovery and efficient heat pumps to deliver…
View more
Sign Up for Electricity Forum’s Newsletter
Stay informed with our FREE Newsletter — get the latest news, breakthrough technologies, and expert insights, delivered straight to your inbox.
Electricity Today T&D Magazine Subscribe for FREE

Stay informed with the latest T&D policies and technologies.
- Timely insights from industry experts
- Practical solutions T&D engineers
- Free access to every issue
