US Army deploys its first floating solar array


US Army deploys its first floating solar array

CSA Z462 Arc Flash Training - Electrical Safety Essentials

Our customized live online or in‑person group training can be delivered to your staff at your location.

  • Live Online
  • 6 hours Instructor-led
  • Group Training Available
Regular Price:
$249
Coupon Price:
$199
Reserve Your Seat Today

Floating Solar at Fort Bragg delivers a 1 MW DoD-backed floatovoltaic array on Big Muddy Lake, boosting renewable energy, resilience, and efficiency via water cooling, with Duke Energy and Ameresco supporting backup power.


Key Points

A 1 MW floating PV array on Big Muddy Lake, built by the US Army to boost efficiency, resilience, and backup power.

✅ 1 MW array supplies backup power for training facilities.

✅ Water cooling improves panel efficiency and output.

✅ Partners: Duke Energy, Ameresco; DoD's first floating solar.


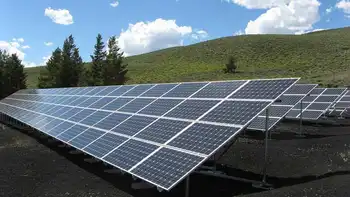
Floating solar had a moment in the spotlight over the weekend when the US Army unveiled a new solar plant sitting atop the Big Muddy Lake at Fort Bragg in North Carolina. It’s the first floating solar array deployed by the Department of Defense, and it’s part of a growing current of support in the US for “floatovoltaics” and other innovations like space-based solar research.

The army says its goal is to boost clean energy, support goals in the Biden solar plan for decarbonization, reduce greenhouse gas emissions, and give the nearby training facility a source of backup energy during power outages. The panels will be able to generate about one megawatt of electricity, which can typically power about 190 homes, and, when paired with solar batteries, enhance resilience during extended outages.

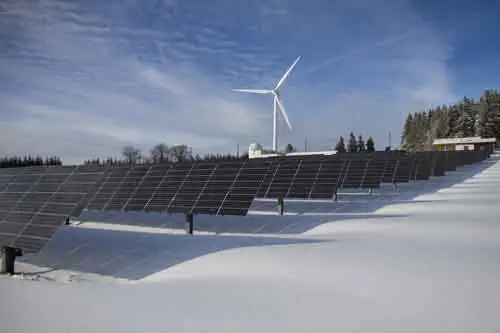
The installation, the largest in the US Southeast, is a big win for floatovoltaics, and projects like South Korea’s planned floating plant show global momentum for the technology, which has yet to make a big splash in the US. They only make up 2 percent of solar installations annually in the country, according to Duke Energy, which collaborated with Fort Bragg and the renewable energy company Ameresco on the project, even as US solar and storage growth accelerates nationwide.

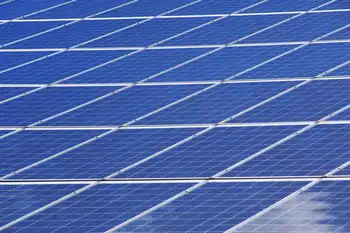
Upfront costs for floating solar have typically been slightly more expensive than for its land-based counterparts. The panels essentially sit on a sort of raft that’s tethered to the bottom of the body of water. But floatovoltaics come with unique benefits, complementing emerging ocean and river power approaches in water-based energy. Hotter temperatures make it harder for solar panels to produce as much power from the same amount of sunshine. Luckily, sitting atop water has a cooling effect, which allows the panels to generate more electricity than panels on land. That makes floating solar more efficient and makes up for higher installation costs over time.

And while solar in general has already become the cheapest electricity source globally, it’s pretty land-hungry, so complementary options like wave energy are drawing interest worldwide. A solar farm might take up 20 times more land than a fossil fuel power plant to produce a gigawatt of electricity. Solar projects in the US have already run into conflict with some farmers who want to use the same land, for example, and with some conservationists worried about the impact on desert ecosystems.


Related News

Related News

Whooping cranes steer clear of wind turbines when selecting stopover sites

Whooping crane migration near wind turbines shows strong avoidance of stopover habitat within 5 km, reshaping Great Plains siting decisions, reducing collision risk, and altering routes across croplands, grasslands, and wetlands.


Key Points

It examines cranes avoiding stopovers within 5 km of turbines, reshaping habitat use and routing across the Great Plains.

✅ Cranes 20x likelier to rest >5 km from turbines.

✅ About 5% of high-quality stopover habitat is impacted.

✅ Findings guide wind farm siting across Great Plains wetlands.


As gatherings to observe whooping cranes join the ranks of online-only events this year, a new study offers insight into how the endangered bird is faring on a landscape increasingly dotted with wind turbines across regions. The paper, published this week in Ecological Applications, reports that whooping cranes migrating through the U.S. Great Plains avoid “rest stop” sites that are within 5 km of wind-energy infrastructure.

Avoidance of wind turbines can decrease collision mortality for birds, but can also make it more difficult and time-consuming for migrating flocks to find safe and suitable rest and refueling locations. The study’s insights into migratory behavior could improve future siting decisions as wind energy infrastructure continues to expand, despite pandemic-related investment risks for developers.

“In the past, federal agencies had thought of impacts related to wind energy primarily associated with collision risks,” said Aaron Pearse, the paper’s first author and a research wildlife biologist for the U.S. Geological Survey’s Northern Prairie Wildlife Research Center in Jamestown, N.D. “I think this research changes that paradigm to a greater focus on potential impacts to important migration habitats.”

Some policymakers have also rejected false health claims about wind turbines and cancer in public debate, underscoring the need for evidence-based decisions.

The study tracked whooping cranes migrating across the Great Plains, a region that encompasses a mosaic of croplands, grasslands and wetlands. The region has seen a rapid proliferation of wind energy infrastructure in recent years: in 2010, there were 2,215 wind towers within the whooping crane migration corridor that the study focused on; by 2016, when the study ended, there were 7,622 wind towers within the same area.

Pearse and his colleagues found that whooping cranes migrating across the study area in 2010 and 2016 were 20 times more likely to select “rest stop” locations at least 5 km away from wind turbines than those closer to turbines, a pattern with implications for developers as solar incentive changes reshape wind market dynamics according to industry analyses.

The authors estimated that 5% of high-quality stopover habitat in the study area was affected by presence of wind towers. Siting wind infrastructure outside of whooping cranes’ migration corridor would reduce the risk of further habitat loss not only for whooping cranes, but also for millions of other birds that use the same land for breeding, migration, and wintering habitat, and real-world siting controversies, such as an Alberta wind farm cancellation, illustrate how local factors shape outcomes for wildlife.


Related News

View more

Solar Power Becomes EU’s Top Electricity Source

Solar has become the EU’s main source of electricity, marking a historic turning point in Europe’s energy mix as solar power surpasses nuclear and wind, accelerates renewable expansion, lowers carbon emissions, and strengthens the EU’s clean energy transition.


Why has Solar Become the EU’s Main Source of Electricity?

Solar has become the EU’s primary source of electricity due to rapid solar expansion, lower installation costs, and robust clean energy policies, which have boosted generation, reduced fossil fuel dependence, and accelerated Europe’s transition toward sustainability.

✅ Surging solar capacity and falling costs

✅ Policy support for renewable energy growth

✅ Reduced reliance on oil, gas, and coal


For the first time in history, solar energy became the leading source of electricity generation in the European Union in June 2025, marking a major milestone in the continent’s transition toward renewable energy, as renewables surpassed fossil fuels across the bloc this year. According to new data from Eurostat, more than half of the EU's net electricity production in the second quarter of the year came from renewable sources, with solar power leading the way.

Between April and June 2025, renewables accounted for 54 percent of the EU’s electricity generation, a 1.3 percent increase compared to the same period in 2024. The rise was driven primarily by solar energy, with countries like Germany seeing a solar boost amid the energy crisis, which generated 122,317 gigawatt-hours (GWh) in the second quarter—enough, in theory, to power around three million homes.

Rob Stait, a spokesperson for Alight, one of Europe’s leading solar developers, described the achievement as “heartening.” He said, “Solar’s boom is because it can generate huge energy cost savings, and it's easy and quick to install and scale. A solar farm can be developed in a year, compared to at least five years for wind and at least ten for nuclear. But most importantly, it provides clean, renewable power, and its increased adoption drastically reduces the reliance of Europe on Russian oil and gas supplies.”

Eurostat’s data shows that June 2025 was the first month ever when solar overtook all other energy sources, accounting for 22 percent of the EU’s energy mix, reflecting a broader renewables surge across the region. Nuclear power followed closely at 21.6 percent, wind at 15.8 percent, hydro at 14.1 percent, and natural gas at 13.8 percent.

The shift comes at a critical time as Europe continues to navigate the economic and energy challenges brought on by Russia’s ongoing war in Ukraine. With fossil fuel markets remaining volatile, countries have increasingly viewed investment in renewables as both an environmental and strategic imperative. As Stait noted, energy resilience and renewable infrastructure have now become a “strategic necessity.”

Denmark led the EU in renewable energy generation during the second quarter, producing 94.7% of its electricity from renewable sources. It was followed by Latvia (93.4%), Austria (91.8%), Croatia (89.5%), and Portugal (85.6%). Luxembourg recorded the largest year-on-year increase, up 13.5 percent, largely due to a surge in solar production. Belgium also saw strong growth, with a 9.1 percent rise in renewable generation compared to 2024, while Ireland targets over one-third green electricity within four years.

At the other end of the spectrum, Slovakia, Malta, and the Czech Republic lagged behind, producing just 19.9%, 21.2%, and 22.1% of their electricity from renewable sources, respectively.

Stait believes the continued expansion of renewables will help stabilize and eventually lower electricity prices across Europe. “The accelerated buildout of renewables will ultimately lower bills for both businesses and other users—but slower buildouts mean sky-high prices may linger,” he said.

He added a call for decisive action: “My advice to European nations would be to keep going further and faster. There needs to be political action to solve grid congestion, and to create opportunities for innovation and manufacturing in Europe will be critical to keep momentum.”

With solar energy now taking the lead for the first time, Europe’s clean energy transformation appears to be entering a new phase, as global renewables set new records and momentum builds—one that combines environmental sustainability with energy security and economic opportunity.


Related Articles

View more

Canada, Germany to work together on clean energy

Clean Energy Transition spans hydrogen strategies, offshore wind and undersea cables, decarbonization pledges, and net-zero targets, including green vs blue hydrogen, carbon capture, sustainable aviation fuel, forest conservation, and wetland protection in Canadian policy.


Key Points

A shift to low-carbon systems via hydrogen, renewables, net-zero policies, carbon capture, and conservation.

✅ Hydrogen pathways: green vs blue with carbon capture

✅ Grid expansion: offshore wind and undersea cables in Japan

✅ Policy and corporate moves: net-zero, SAF, forests, wetlands


The Canadian federal government is set to sign a new agreement with Germany to strategize on a “clean-energy transition,” with clean hydrogen in Canada expected to be a key player the Globe and Mail reports.

“Germany is probably the world’s most interesting market for hydrogen right now, and Canada is potentially a very big power in its production,” Sabine Sparwasser, Germany’s ambassador to Canada, said in an interview.

However, some friction is expected as Natural Resources Minister Seamus O’Regan has been endorsing “blue” hydrogen, while Germany has been more interested in “green” hydrogen. The former hydrogen is produced from natural gas or other fossil fuels, while simultaneously “using carbon-capture technology to minimize emissions from the process.” In contrast, “green” hydrogen, is manufactured from non-fossil fuel sources, and cleaning up Canada's electricity is critical to meeting climate pledges.

“How the focus on blue hydrogen will be aligned with Canada’s goal of reaching climate neutrality by 2050 is not spelled out in detail,” says an executive summary of the report by the Berlin-based think tank and consultancy Adelphi. “As a result, the strategy seems to be more of a vision for the future of those provinces with large fossil fuel resources.”

According to an IEA report Canada will need more electricity to hit net-zero, underscoring the strategy questions.


Internationally

Japan is in talks to develop undersea cables that would bring offshore wind energy to Tokyo and the Kansai region, as the country hopes to more than quadrable its wind capacity from 10 gigawatts in 2030 to 45 gigawatts in 2040. The construction of the cables would cost about US$9.2 billion.

In Western Canada, bridging the electricity gap between Alberta and B.C. makes similar climate sense, proponents argue.

Approximately 80 per cent of that offshore power is expected to be built in Hokkaido, Tohoku, and Kyushu regions. The project is part of the country’s pledge to achieve decarbonization by 2050, according to BNN Bloomberg.

Meanwhile, Russia is falling behind in the world’s transition to clean energy.

“What’s the alternative? Russia can’t be an exporter of clean energy, that path isn’t open for us,” says Konstantin Simonov, director of the National Energy Security Fund, a Moscow consultancy whose clients include major oil and gas companies. “We can’t just swap fossil fuel production for clean energy production, because we don’t have any technology of our own.” Ultimately, natural gas will always be cheaper than renewable energy in Russia, Simonov added. This story also from BNN Bloomberg.

Finally, New Zealand’s Tilt Renewables Ltd., an electricity company, has announced it would be acquired by Powering Australian Renewables (PowAR) for NZ$2.94 billion (US$2.10 billion). PowAR is Australia’s largest owner of wind and solar energy, and the deal will give the energy giant access to Tilt’s 20 wind farms. Reuters has the story.


In Canada  

Air Canada has unveiled plans to fight climate change. Specifically, the airlines giant has committed to reducing greenhouse gases (GHG) by 20 per cent from flights by 2030, investing $50 million in sustainable aviation fuel (SAF), and ensuring net-zero emissions by 2050.

In other news, B.C. is facing mounting pressure to abstain from logging “old growth forests” while the government transitions to more sustainable forestry policies. A report titled A New Future for Old Forests called on the provincial government to act within six months to protect such forests in April 2020.

The province's Site C mega dam is billions over budget but will go ahead, the premier said, highlighting the energy sector's complexity.

Last September, the province announced, “it would temporarily defer old growth harvesting in close to 353,000 hectares in nine different areas.” The B.C. government will hold consultations with First Nations and other forestry stakeholders “to determine the next areas where harvesting may be deferred,” according to Forests Minister Katrine Conroy. The Canadian Press has more.

Separately, LNG powered with electricity could be a boon for B.C.'s independent power producers, analysts say.

Finally, Pickering Developments Inc. has come forward saying it will not “alter or remove the wetland” that was meant to house an Amazon facility, according to CBC News.

The announcement comes after CBC News’s previously reported that the Toronto and Region Conservation Authority (TRCA) was pressured to issue a construction permit to Pickering Developments Inc. by Doug Ford’s provincial government. However, on March 12, an official with Amazon Canada told CBC News that the company no longer wished to build a warehouse on the site.

“In light of a recent announcement that a new fulfilment centre will no longer be located on this property, this voluntary undertaking ensures that no work, legally authorized by that permit, will occur,” Pickering Development Inc. said in a statement provided to CBC Toronto.


Related News

View more

Wind and solar power generated more electricity in the EU last year than gas. Here's how

EU Renewable Energy Transition accelerates as solar and wind overtake gas, cutting coal reliance and boosting REPowerEU goals; falling electricity demand, hydro and nuclear recovery, and grid upgrades drive a cleaner, secure power mix.


Key Points

It is the EU's shift to solar and wind, surpassing gas and curbing coal to meet REPowerEU targets.

✅ Solar and wind supplied 22% of EU electricity in 2022.

✅ Gas fell behind; coal stayed near 16% with no major rebound.

✅ Demand fell; hydro and nuclear expected to recover in 2023.


European countries were forced to accelerate their renewable energy capacity after Russia's invasion of Ukraine sparked a global energy crisis amid a surge in global power demand that exceeded pre-pandemic levels. The EU’s REPowerEU plan aims to increase the share of renewables in final energy consumption overall to 45 percent by the end of the decade.

However, a new report by energy think tank Ember shows that the EU’s green energy transition is already making a significant difference. Solar and wind power generated more than a fifth (22 percent) of its electricity in 2022, pulling ahead of fossil gas (20 percent) for the first time, according to the European Electricity Review 2023.

Europe also managed to avoid resorting to emissions-intensive coal power for electricity generation as a consequence of the energy crisis, even as renewables to eclipse coal globally by mid-decade. Coal generated just 16 percent of the EU’s electricity last year, an increase of just 1.5 percentage points.

“Europe has avoided the worst of the energy crisis,” says Ember’s Head of Data Insights, Dave Jones. “The shocks of 2022 only caused a minor ripple in coal power and a huge wave of support for renewables. Any fears of a coal rebound are now dead.”

Ember’s analysis reveals that the EU faced a "triple crisis" in the electricity sector in 2022, as stunted hydro and nuclear output compounded the shock. "Just as Europe scrambled to cut ties with its biggest supplier of fossil gas, it faced the lowest levels of hydro and nuclear (power) in at least two decades, which created a deficit equal to 7 percent of Europe’s total electricity demand in 2022," the report says. A severe drought across Europe, French nuclear outages as well as the closure of German nuclear outlets were responsible for the drop.


Solar power shines through
However, the record surge in solar and wind power generation helped compensate for the nuclear and hydropower deficit. Solar power rose the fastest, growing by a record 24 percent last year which almost doubled its previous record, with wind growing by 8.6 percent.

Forty-one gigawatts of solar power capacity was added in 2022, almost 50 percent more than the year before. Ember says that 20 EU countries achieved solar records in 2022, with Germany, Spain, Poland, the Netherlands and France adding the most solar capacity.

The Netherlands and Greece generated more power from solar than coal for the first time. Greece is also predicted to reach its 2030 solar capacity target by the end of this year.


EU electricity demand falls
A significant drop in electricity use in 2022 also helped lessen the impact of Europe’s energy crisis. Demand fell by 7.9 percent in the last quarter of the year, despite the continent heading into winter. This was close to the 9.6 percent fall experienced when Europe was in Covid-19 lockdown in mid-2020.

"Mild weather was a deciding factor, but affordability pressures likely played a role, alongside energy efficiency improvements and citizens acting in solidarity to cut energy demand in a time of crisis," the report says.

A ‘coal comeback’ fails to materialize
The almost 8 percent fall in electricity demand in the last three months of 2022 was the main factor in the 9 percent fall in gas and coal generation during that time. However, Ember says that had France’s nuclear plants been operating at the same capacity as 2021, the EU’s fossil fuel generation would have fallen twice as fast in the last quarter of 2022.

The report says: "Coal power in the EU fell in all four of the final months of 2022, down 6 percent year-on-year. The 26 coal units placed on emergency standby for winter ran at an average of just 18 percent capacity. Despite importing 22 million tonnes of extra coal throughout 2022, the EU only used a third of it."

Gas generation was very similar compared to 2021, up just 0.8 percent. It made up 20 percent of the EU electricity mix in 2022, up from 19 percent the year before.


Fossil fuel generation set to fall in 2023
Ember says low-emissions sources like solar and wind power will continue to accelerate in 2023 and hydropower and French nuclear capacity will also recover. With electricity demand likely to continue to fall, it estimates that fossil fuel-generation "could plummet" by 20 percent in 2023.

Gas generation will fall the fastest, Ember predicts, as it will remain more expensive than coal over the next few years. "The large fall in gas generation means the power sector is likely to be the fastest falling segment of gas demand during 2023, helping to bring calm to European gas markets as Europe adjusts to life without Russian gas."

In order to stick to the 2015 Paris Agreement target of limiting global warming to no more than 1.5 degrees Celsius compared to pre-industrial levels, Ember says Europe must fully decarbonize its power system by the mid-2030s. Its modeling shows that this is possible without compromising the security of supply.

However, the report says "making this vision a reality will require investment above and beyond existing plans, as well as immediate action to address barriers to the expansion of clean energy infrastructure. Such a mobilization would boost the European economy, cement the EU’s position as a climate leader and send a vital international message that these challenges can be overcome."


Related News

View more

Within A Decade, We Will All Be Driving Electric Cars

Electric Vehicle Price Parity 2027 signals cheaper EV manufacturing as battery costs plunge, widening model lineups, and tighter EU emissions rules; UBS and BloombergNEF foresee parity, with TCO advantages over ICE amid growing fast-charging networks.


Key Points

EV cost parity in 2027 when manufacturing undercuts ICE, led by cheaper batteries, wider lineups, and emissions policy.

✅ Battery costs drop 58% next decade, after 88% fall

✅ Manufacturing parity across segments from 2027

✅ TCO favors EVs; charging networks expand globally


A Bloomberg/NEF report commissioned by Transport & Environment forecasts 2027 as the year when electric vehicles will start to become cheaper to manufacture than their internal combustion equivalents across all segments, aligning with analyses that the EV age is arriving ahead of schedule for consumers and manufacturers alike, mainly due to a sharp drop in battery prices and the appearance of new models by more manufacturers.

Batteries, which have fallen in price by 88% over the past decade and are expected to plunge by a further 58% over the next 10 years, make up between one-quarter and two-fifths of the total price of a vehicle. The average pre-tax price of a mid-range electric vehicle is around €33,300, and higher upfront prices concern many UK buyers compared to €18,600 for its diesel or gasoline equivalent. In 2026, both are expected to cost around €19,000, while in 2030, the same electric car will cost €16,300 before tax, while its internal combustion equivalent will cost €19,900, and that’s without factoring in government incentives.

Other reports, such as a recent one by UBS, put the date of parity a few years earlier, by 2024, after which they say there will be little reason left to buy a non-electric vehicle, as the market has expanded from near zero to 2 million in just five years.

In Europe, carmakers will become a particular stakeholder in this transition due to heavy fines for exceeding emissions limits calculated on the basis of the total number of vehicles sold. Increasing the percentage of electric vehicles in the annual sales portfolio is seen by the industry as the only way to avoid these fines. In addition to brands such as Bentley or Jaguar Land Rover, which have announced the total abandonment of internal combustion engine technology by 2025, or Volvo, which has set 2030 as the target date, other companies such as Ford, which is postponing this date in its home market, also set 2030 for the European market, which clearly demonstrates the suitability of this type of policy.

Nevertheless internal combustion vehicles will continue to travel on the roads or will be resold in developing countries. In addition to the price factor, which is even more accentuated when estimates are carried out in terms of total cost of ownership calculations due to the lower cost of electric recharging versus fuel and lower maintenance requirements, other factors such as the availability of fast charging networks must be taken into account.

While price parity is approaching, it is worth thinking about the factors that are causing car sales, which are still behind gasoline models in share, to suffer: the chip crisis, which is strongly affecting the automotive industry and will most likely extend until 2022, is creating production problems and the elimination of numerous advanced electronic options in many models, which reduces the incentive to purchase a vehicle at the present time. These types of reasons could lead some consumers to postpone purchasing a vehicle precisely when we may be talking about the final years for internal combustion technology, which would increase the likelihood that, later on and as the price gap closes, they would opt for an electric vehicle.

Finally, in the United States, the ambitious infrastructure plan put in place by the Biden administration also promises to accelerate the transition to electric vehicles by addressing key barriers to mainstream adoption such as charging access, which in turn is fueling the interest of automotive companies to have more electric vehicles in their range. In Europe, meanwhile, more Chinese brands offering electric vehicles are beginning to enter the most advanced markets, such as Norway and the Netherlands, with plans to expand to the rest of the continent with very competitive offers in terms of price.

One way or another, the future of the automotive industry is electric, and the transition will take place during the remainder of this decade. You might want to think about it if you are weighing whether it’s time to buy an electric car this year.


Related News

View more

Record numbers of solar panels were shipped in the United States during 2021

U.S. Solar Panel Shipments 2021 surged to 28.8 million kW of PV modules, tracking utility-scale and small-scale capacity additions, driven by imports from Asia, resilient demand, supply chain constraints, and declining prices.


Key Points

Record 28.8M kW PV modules shipped in 2021; 80% imports; growth in utility- and small-scale capacity with lower prices.

✅ 28.8M kW shipped, up from 21.8M kW in 2020 (record capacity)

✅ 80% of PV module shipments were imports, mainly from Asia

✅ Utility-scale +13.2 GW; small-scale +5.4 GW; residential led


U.S. shipments of solar photovoltaic (PV) modules (solar panels) rose to a record electricity-generating capacity of 28.8 million peak kilowatts (kW) in 2021, from 21.8 million peak kW in 2020, based on data from our Annual Photovoltaic Module Shipments Report. Continued demand for U.S. solar capacity drove this increase in solar panel shipments in 2021, as solar's share of U.S. electricity continued to rise.

U.S. solar panel shipments include imports, exports, and domestically produced and shipped panels. In 2021, about 80% of U.S. solar panel module shipments were imports, primarily from Asia, even as a proposed tenfold increase in solar aims to reshape the U.S. electricity system.

U.S. solar panel shipments closely track domestic solar capacity additions; differences between the two usually result from the lag time between shipment and installation, and long-term projections for solar's generation share provide additional context. We categorize solar capacity additions as either utility-scale (facilities with one megawatt of capacity or more) or small-scale (largely residential solar installations).

The United States added 13.2 gigawatts (GW) of utility-scale solar capacity in 2021, an annual record and 25% more than the 10.6 GW added in 2020, according to our Annual Electric Generator Report. Additions of utility-scale solar capacity reached a record high, reflecting strong growth in solar and storage despite project delays, supply chain constraints, and volatile pricing.

Small-scale solar capacity installations in the United States increased by 5.4 GW in 2021, up 23% from 2020 (4.4 GW), as solar PV and wind power continued to grow amid favorable government plans. Most of the small-scale solar capacity added in 2021 was installed on homes. Residential installations totaled more than 3.9 GW in 2021, compared with 2.9 GW in 2020.

The cost of solar panels has declined significantly since 2010. The average value (a proxy for price) of panel shipments has decreased from $1.96 per peak kW in 2010 to $0.34 per peak kW in 2021, as solar became the third-largest renewable source and markets scaled. Despite supply chain constraints and higher material costs in 2021, the average value of solar panels decreased 11% from 2020.

In 2021, the top five destination states for U.S. solar panel shipments were:

California (5.09 million peak kW)
Texas (4.31 million peak kW)
Florida (1.80 million peak kW)
Georgia (1.15 million peak kW)
Illinois (1.12 million peak kW)
These five states accounted for 46% of all U.S. shipments, and 2023 utility-scale project pipelines point to continued growth.


Related News

View more

Sign Up for Electricity Forum’s Newsletter

Stay informed with our FREE Newsletter — get the latest news, breakthrough technologies, and expert insights, delivered straight to your inbox.

Electricity Today T&D Magazine Subscribe for FREE

Stay informed with the latest T&D policies and technologies.
  • Timely insights from industry experts
  • Practical solutions T&D engineers
  • Free access to every issue

Download the 2025 Electrical Training Catalog

Explore 50+ live, expert-led electrical training courses –

  • Interactive
  • Flexible
  • CEU-cerified