Renewables Projected to Soon Be One-Fourth of US Electricity Generation


solar power

Electrical Testing & Commissioning of Power Systems

Our customized live online or in‑person group training can be delivered to your staff at your location.

  • Live Online
  • 12 hours Instructor-led
  • Group Training Available
Regular Price:
$599
Coupon Price:
$499
Reserve Your Seat Today

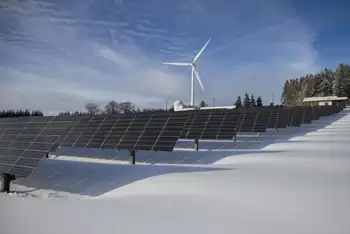
U.S. Renewable Energy Forecast 2024 will see wind and solar power surpass one-fourth of electricity generation, EIA projects, as coal declines, natural gas dips, and clean energy capacity, grid integration, and policy incentives expand.


Key Points

EIA outlook: renewables at 26% of U.S. power in 2024, led by wind and solar as coal declines and gas share dips.

✅ Wind and solar hit 18% combined, surpassing coal's 17%.

✅ Natural gas dips to 37% as demand rebounds modestly.

✅ Coal plant closures accelerate amid costs, emissions, and age.


Renewable energy is poised to reach a milestone, after a record 28% in April this year, as a new government report projects that wind, solar and other renewable sources will exceed one-fourth of the country’s electricity generation for the first time, in 2024.

This is one of the many takeaways from the federal government’s Short Term Energy Outlook, a monthly report whose new edition is the first to include a forecast for 2024. The report’s authors in the Energy Information Administration are expecting renewables to increase in market share, while natural gas and coal would both decrease.

From 2023 to 2024, renewables would rise from 24 percent to 26 percent of U.S. electricity generation; coal’s share would drop from 18 percent to 17 percent; gas would remain the leader but drop from 38 percent to 37 percent; and nuclear would be unchanged at 19 percent.

It was a big deal in 2020 when generation from renewables passed coal for the first time in 130 years over a full year. Coal made a comeback in 2021 and then retreated again in 2022 as renewables surpassed coal in generation. The ups and downs were largely the result of fluctuations in electricity demand during and then after the Covid-19 pandemic.

The new report indicates that coal doesn’t have another comeback in the works. This fuel, which was the country’s leading electricity source less than a decade ago, is declining as many coal-fired power plants are old and economically uncompetitive. Coal plants continue to close, and developers aren’t building new ones because of concerns about high costs and emissions, a trend underscored when renewables became the second-most prevalent source in 2020 across the U.S.

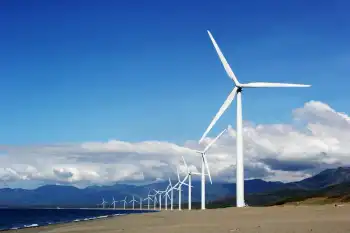
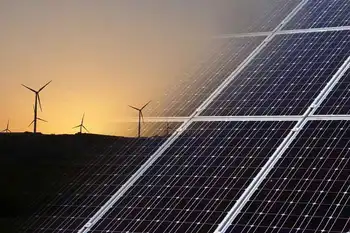
The growth in renewable energy is coming from wind and solar power, with wind responsible for about one-third of the growth and solar accounting for two-thirds, the report says, and combined output from wind and solar has already exceeded nuclear for the first time in the U.S. Other renewable sources, like hydropower and biomass, would be flat.

In fact, the growth of wind and solar is projected to be so swift that the combination of just those two sources would be 18 percent of the U.S. total by 2024, which would surpass coal’s 17 percent.

A key variable is overall electricity consumption. EIA is projecting that this will fall 1 percent in 2023 compared to 2022, due a mild summer. Then, consumption will increase 1 percent in 2024.

If demand was rising more, then natural gas power would likely gain market share because of gas power plants’ ability to vary their output as needed to respond to changes in demand.

I asked Eric Gimon, a senior fellow at the think tank Energy Innovation, what he thinks of these latest numbers.

He said wind and solar have gotten so big that it almost makes sense to track them as their own categories as opposed to lumping them into the larger category of renewables. He expects that the government will do this sometime soon.

Also, he thinks the projected increases for wind and solar, while substantial, are still smaller than those resources are likely to grow.

“My experience over the last 10 years is that the EIA tends to have flattish forecasts,” he said, meaning the federal office has underestimated the actual growth.

Some energy analysts have criticized EIA for being slow to recognize the growth of renewables. But much of the criticism is about the Annual Energy Outlook, which has numbers going out to mid-century, even as the U.S. is moving toward 30% from wind and solar by the end of the decade. The Short Term Energy Outlook, with numbers going one year into the future, has been more reliable.

Gimon said EIA is “kind of like your conservative uncle” in its forecasts, so it’s notable that the office expects to see a significant uptick in wind and solar.

Even so, he thinks the latest Short Term Energy Outlook should be read as the lower end of the range of potential increase for wind and solar.

For him to be right, the wind and solar industries will need to figure out solutions to the challenges they’ve been having in obtaining parts; they will need to make progress in dealing with local opposition to many projects and in having enough interstate power lines to deliver the electricity. And, new policies like the Inflation Reduction Act will need to have their desired effect of encouraging projects through the use of tax incentives.

It’s not much of a stretch to imagine that clean energy industries will make some progress on all of those fronts.

Related News

Electric truck fleets will need a lot of power, but utilities aren't planning for it

Electric Fleet Grid Planning aligns utilities, charging infrastructure, distribution upgrades, and substation capacity to meet megawatt loads from medium- and heavy-duty EV trucks and buses, enabling managed charging, storage, and corridor fast charging.


Key Points

A utility plan to upgrade feeders and substations for EV fleets, coordinating charging, storage, and load management.

✅ Plans distribution, substation, and transformer upgrades

✅ Supports managed charging and on-site storage

✅ Aligns utility investment with fleet adoption timelines


As more electric buses and trucks enter the market, future fleets will require a lot of electricity for charging and will challenge state power grids over time. While some utilities in California and elsewhere are planning for an increase in power demand, many have yet to do so and need to get started.

This issue is critical, because freight trucks emit more than one-quarter of all vehicle emissions. Recent product developments offer growing opportunities to electrify trucks and buses and slash their emissions (see our recent white paper). And just last week, a group of 15 states plus D.C. announced plans to fully electrify truck sales by 2050. Utilities will need to be ready to power electric fleets.

Electric truck fleets need substantial power
Power for trucks and buses is generally more of an issue than for cars because trucks typically have larger batteries and because trucks and buses are often parts of fleets with many vehicles that charge at the same location. For example, a Tesla Model 3 battery stores 54-75 kWh; a Proterra transit bus battery stores 220-660 kWh. In Amsterdam, a 100-bus transit fleet is powered by a set of slow and fast chargers that together have a peak load of 13 MW (megawatts). This is equivalent to the power used by a typical large factory. And they are thinking of expanding the fleet to 250 buses.

California utilities are finding that grid capacity is often adequate in the short term, but that upgrade needs likely will grow in the medium term.
Many other fleets also will need a lot of "juice." For example, a rough estimate of the power needed to serve a fleet of 200 delivery vans at an Amazon fulfillment center is about 4 MW. And for electric 18-wheelers, chargers may need up to 2 MW of power each; a recent proposal calls for charging stations every 100 miles along the U.S. West Coast’s I-5 corridor, highlighting concerns about EVs and the grid as each site targets a peak load of 23.5 MW.

Utilities need distribution planning
These examples show the need for more power at a given site than most utilities can provide without planning and investment. Meeting these needs often will require changes to primary and secondary power distribution systems (feeders that deliver power to distribution transformers and to end customers) and substation upgrades. For large loads, a new substation may be needed. A paper recently released by the California Electric Transportation Coalition estimates that for loads over 5 MW, distribution system and substation upgrades will be needed most of the time. According to the paper, typical utility costs are $1 million to $9 million for substation upgrades, $150,000 to $6 million for primary distribution upgrades, and $5,000 to $100,000 for secondary distribution upgrades. Similarly, Black and Veatch, in a paper on Electric Fleets, also provides some general guidance, shown in the table below, while recognizing that each site is unique.

California policy pushes utilities toward planning
In California, state agencies and a statewide effort called CALSTART have been funding demonstration projects and vehicle and charger purchases for several years to support grid stability as electrification ramps up. The California Air Resources Board voted in June to phase in zero-emission requirements for truck sales, mandating that, beginning in 2024, manufacturers must increase their zero-emission truck sales to 30-50 percent by 2030 and 40-75 percent by 2035. By 2035, more than 300,000 trucks will be zero-emission vehicles.

California utilities operate programs that work with fleet owners to install the necessary infrastructure for electric vehicle fleets. For example, Southern California Edison operates the Charge Ready Transport program for medium- and heavy-duty fleets. Normally, when customers request new or upgraded service from the utility, there are fees associated with the new upgrade. With Charge Ready, the utility generally pays these costs, and it will sometimes pay half the cost of chargers; the customer is responsible for the other half and for charger installation costs. Sites with at least two electric vehicles are eligible, but program managers report that at least five vehicles are often needed for the economics to make sense for the utility.

One way to do this is to develop and implement a phased plan, with some components sized for future planned growth and other components added as needed. Southern California Edison, for example, has 24 commitments so far, and has a five-year goal of 870 sites, with an average of 10 chargers per site. The utility notes that one charger usually can serve several vehicles and that cycling of charging, some storage, and other load management techniques through better grid coordination can reduce capacity needs (a nominal 10 MW load often can be reduced below 5 MW).

Through this program, utility representatives are regularly talking with fleet operators, and they can use these discussions to help identify needed upgrades to the utility grid. For example, California transit agencies are doing the planning to meet a California Air Resources Board mandate for 100 percent electric or fuel cell buses by 2040; utilities are talking with the agencies and their consultants as part of this process. California utilities are finding that grid capacity is often adequate in the short term, but that upgrade needs likely will grow in the medium term (seven to 10 years out). They can manage grid needs with good planning (school buses generally can be charged overnight and don’t need fast chargers), load management techniques and some energy storage to address peak needs.

Customer conversations drive planning elsewhere
We also spoke with a northeastern utility (wishing to be unnamed) that has been talking with customers about many issues, including fleets. It has used these discussions to identify a few areas where grid upgrades might be needed if fleets electrify. It is factoring these findings into a broader grid-planning effort underway that is driven by multiple needs, including fleets. Even within an integrated planning effort, this utility is struggling with the question of when to take action to prepare the electric system for fleet electrification: Should it act on state or federal policy? Should it act when the specific customer request is submitted, or is there something in between? Recognizing that any option has scheduling and cost allocation implications, it notes that there are no easy answers.

Many utilities need to start paying attention
As part of our research, we also talked with several other utilities and found that they have not yet looked at how fleets might relate to grid planning. However, several of these companies are developing plans to look into these issues in the next year. We also talked with a major truck manufacturer, also wishing to remain unnamed, that views grid limitations as a key obstacle to truck electrification. 

Based on these cases, it appears that fleet electrification can have a substantial impact on electric grids and that, while these impacts are small at present, they likely will grow over time. Fleet owners, electric utilities, and utility regulators need to start planning for these impacts now, so that grid improvements can be made steadily as electric fleets grow. Fleet and grid planning should happen in parallel, so that grid upgrades do not happen sooner or later than needed but are in place when needed, including the move toward a much bigger grid as EV adoption accelerates. These grid impacts can be managed and planned for, but the time to begin this planning is now.


Related News

View more

'Consumer Reports' finds electric cars really do save money in the long run

Electric Vehicle Ownership Costs include lower maintenance, repair, and fuel expenses; Consumer Reports shows BEV and PHEV TCO beats ICE over 200,000 miles, with per-mile savings compounding through electricity prices and reduced service.


Key Points

Lifetime EV expenses, typically lower than ICE, due to cheaper electricity, reduced maintenance, and fewer repairs.

✅ BEV: $0.012/mi to 50k; $0.028/mi after; vs ICE up to $0.06/mi

✅ PHEV: $0.021/mi to 50k; $0.031/mi after; still below ICE

✅ Savings increase over 200k miles from fuel and service reductions


Electric vehicles are a relatively new technology, and the EV age is arriving ahead of schedule today. Even though we technically saw the first battery-powered vehicles more than 100 years ago, they haven’t really become viable transportation in the modern world until recently, and they are greener than ever in all 50 states as the grid improves.

As viable as they may now be, however, it still seems they’re unarguably more expensive than their conventional internal-combustion counterparts, prompting many to ask whether it’s time to buy an electric car today. Well, until now.

Lower maintenence costs and the lower price of electricity versus gasoline (see the typical cost to charge an electric vehicle in most regions) actually make electric cars much cheaper in the long run, despite their often higher purchase price, according to a new survey by Consumer Reports. The information was collected using annual reliability surveys conducted by CR in 2019 and 2020.

In the first 50,000 miles (80,500 km), battery electric vehicles cost just US$0.012 per mile for maintenence and repairs, while plug-in hybrid models bump that number up to USD$0.021. Compare these numbers to the typical USD$0.028 cost for internal combustion vehicles, and it becomes clear the more you drive, the more you will save, and across the U.S. plug-ins logged 19 billion electric miles in 2021 to prove the point. After 50,000 miles, the costs for BEV and PHEV vehicles is US$0.028 and US$0.031 respectively, while ICE vehicles jump to US$0.06 per mile.

To put it more practically, if you chose to buy a Model 3 instead of a BMW 330i, you’d see a total US$17,600 in savings over the lifetime of the vehicle, aligning with evidence that EVs are better for the planet and your budget as well, based on average driving. In the SUV sector, buying a Tesla Model Y instead of a Lexus crossover would save US$13,400 (provided the former’s roof doesn’t fly off) and buying a Nissan Leaf over a Honda Civic would save US$6,000 over the lifetime of the vehicles.

CR defines the vehicle’s “lifetime” as 200,000 miles (320,000 km). Ergo the final caveat: while it sounds like driving electric means big savings, you might only see those returns after quite a long period of ownership, though some forecasts suggest that within a decade adoption will be nearly universal for many drivers.


Related News

View more

Stalled spending on electrical grids slows rollout of renewable energy

IEA Grid Expansion Warning highlights stalled investment in power lines and transmission infrastructure, risking renewable energy rollout for solar, wind, EVs, and heat pumps, and jeopardizing climate targets under the Paris Agreement amid connection bottlenecks.


Key Points

IEA alert urging grid investment to expand transmission, connect renewables, and keep 1.5 C climate goals on track.

✅ 80 million km of lines needed by 2040, per IEA

✅ Investment must double to $600B annually by 2030

✅ Permitting delays stall major cross-border projects


Stalled spending on electrical grids worldwide is slowing the rollout of renewable energy and could put efforts to limit climate change at risk if millions of miles of power lines are not added or refurbished in the next few years, the International Energy Agency said.

The Paris-based organization said in the report Tuesday that the capacity to connect to and transmit electricity is not keeping pace with the rapid growth of clean energy technologies such as solar and wind power, electric cars and heat pumps being deployed to move away from fossil fuels, a gap reflected in why the U.S. grid isn't 100% renewable today.

IEA Executive Director Fatih Birol told The Associated Press in an interview that there is a long line of renewable projects waiting for the green light to connect to the grid, including UK renewable backlog worth billions. The stalled projects could generate 1,500 gigawatts of power, or five times the amount of solar and wind capacity that was added worldwide last year, he said.

“It’s like you are manufacturing a very efficient, very speedy, very handsome car — but you forget to build the roads for it,” Birol said.

If spending on grids stayed at current levels, the chance of holding the global increase in average temperature to 1.5 degrees Celsius above pre-industrial levels — the goal set by the 2015 Paris climate accords — “is going to be diminished substantially,” he said.

The IEA assessment of electricity grids around the globe found that achieving the climate goals set by the world’s governments would require adding or refurbishing 80 million kilometers (50 million miles) of power lines by 2040 — an amount equal to the existing global grid in less than two decades.

Annual investment has been stagnant but needs to double to more than $600 billion a year by 2030, the agency said, with U.S. grid overhaul efforts aiming to accelerate upgrades.

It’s not uncommon for a single high-voltage overhead power line to take five to 13 years to get approved through bureaucracy in advanced economies, while lead times are significantly shorter in China and India, according to the IEA, though a new federal rule seeks to boost transmission planning.

The report cited the South Link transmission project to carry wind power from northern to southern Germany. First planned in 2014, it was delayed after political opposition to an overhead line meant it was buried instead, while more pylons in Scotland are being urged to keep the lights on, industry says. Completion is expected in 2028 instead of 2022.

Other important projects that have been held up: the 400-kilometer (250-mile) Bay of Biscay connector between Spain and France, now expected for 2028 instead of 2025, and the SunZia high-voltage line to bring wind power from New Mexico to Arizona and California, while Pacific Northwest goals are hindered by grid limits. Construction started only last month after years of delays.

On the East Coast, the Avangrid line to bring hydropower from Canada to New England was interrupted in 2021 following a referendum in Maine, as New England's solar growth is also creating tension over who pays for grid upgrades. A court overturned the statewide vote rejecting the project in April.


Related News

View more

Solar is now ‘cheapest electricity in history’, confirms IEA

IEA World Energy Outlook 2020 highlights solar power as the cheapest electricity, projects faster renewables growth, models net-zero pathways, assesses COVID-19 impacts, oil and gas demand, and policy scenarios including STEPS, SDS, and NZE2050.


Key Points

A flagship IEA report analyzing energy trends, COVID-19 impacts, renewables growth, and pathways to net-zero in 2050.

✅ Solar now the cheapest electricity in most major markets

✅ Scenarios: STEPS, SDS, NZE2050, plus delayed recovery case

✅ Oil and gas demand uncertain; CO2 peak needs stronger policy


The world’s best solar power schemes now offer the “cheapest…electricity in history” with the technology cheaper than coal and gas in most major countries.

That is according to the International Energy Agency’s World Energy Outlook 2020. The 464-page outlook, published today by the IEA, also outlines the “extraordinarily turbulent” impact of coronavirus and the “highly uncertain” future of global energy use and progress in the global energy transition over the next two decades.

Reflecting this uncertainty, this year’s version of the highly influential annual outlook offers four “pathways” to 2040, all of which see a major rise in renewables across markets. The IEA’s main scenario has 43% more solar output by 2040 than it expected in 2018, partly due to detailed new analysis showing that solar power is 20-50% cheaper than thought.

Despite a more rapid rise for renewables and a “structural” decline for coal, the IEA says it is too soon to declare a peak in global oil use, unless there is stronger climate action. Similarly, it says demand for gas could rise 30% by 2040, unless the policy response to global warming steps up.

This means that, while global CO2 emissions have effectively peaked flatlining in 2019 according to the IEA, they are “far from the immediate peak and decline” needed to stabilise the climate. The IEA says achieving net-zero emissions will require “unprecedented” efforts from every part of the global economy, not just the power sector.

For the first time, the IEA includes detailed modeling of a 1.5C pathway that reaches global net-zero CO2 emissions by 2050. It says individual behaviour change, such as working from home “three days a week”, would play an “essential” role in reaching this new “net-zero emissions by 2050 case” (NZE2050).

Future scenarios
The IEA’s annual World Energy Outlook (WEO) arrives every autumn and contains some of the most detailed and heavily scrutinised analysis of the global energy system. Over hundreds of densely packed pages, it draws on thousands of datapoints and the IEA’s World Energy Model.

The outlook includes several different scenarios, to reflect uncertainty over the many decisions that will affect the future path of the global economy, as well as the route taken out of the coronavirus crisis during the “critical” next decade. The WEO also aims to inform policymakers by showing how their plans would need to change if they want to shift onto a more sustainable path, including creating the right clean electricity investment incentives to accelerate progress.

This year it omits the “current policies scenario” (CPS), which usually “provides a baseline…by outlining a future in which no new policies are added to those already in place”. This is because “[i]t is difficult to imagine this ‘business as-usual’ approach prevailing in today’s circumstances”.

Those circumstances are the unprecedented fallout from the coronavirus pandemic, which remains highly uncertain as to its depth and duration. The crisis is expected to cause a dramatic decline in global energy demand in 2020, with oil demand also dropping sharply as fossil fuels took the biggest hit.

The main WEO pathway is again the “stated policies scenario” (STEPS, formerly NPS). This shows the impact of government pledges to go beyond the current policy baseline. Crucially, however, the IEA makes its own assessment of whether governments are credibly following through on their targets.

The report explains:

“The STEPS is designed to take a detailed and dispassionate look at the policies that are either in place or announced in different parts of the energy sector. It takes into account long-term energy and climate targets only to the extent that they are backed up by specific policies and measures. In doing so, it holds up a mirror to the plans of today’s policy makers and illustrates their consequences, without second-guessing how these plans might change in future.”

The outlook then shows how plans would need to change to plot a more sustainable path, highlighting efforts to replace fossil fuels with electricity in time to meet climate goals. It says its “sustainable development scenario” (SDS) is “fully aligned” with the Paris target of holding warming “well-below 2C…and pursuing efforts to limit [it] to 1.5C”. (This interpretation is disputed.)

The SDS sees CO2 emissions reach net-zero by 2070 and gives a 50% chance of holding warming to 1.65C, with the potential to stay below 1.5C if negative emissions are used at scale.

The IEA has not previously set out a detailed pathway to staying below 1.5C with 50% probability, with last year’s outlook only offering background analysis and some broad paragraphs of narrative.

For the first time this year, the WEO has “detailed modelling” of a “net-zero emissions by 2050 case” (NZE2050). This shows what would need to happen for CO2 emissions to fall to 45% below 2010 levels by 2030 on the way to net-zero by 2050, with a 50% chance of meeting the 1.5C limit, with countries such as Canada's net-zero electricity needs in focus to get there.

The final pathway in this year’s outlook is a “delayed recovery scenario” (DRS), which shows what might happen if the coronavirus pandemic lingers and the global economy takes longer to recover, with knock-on reductions in the growth of GDP and energy demand.


Related News

View more

Low-emissions sources are set to cover almost all the growth in global electricity demand in the next three years

IEA Electricity Market Outlook 2023-2025 projects faster demand growth as renewables and nuclear dominate supply, stabilizing power-sector carbon emissions, with Asia leading expansion despite energy crisis shocks and weather-driven volatility.


Key Points

IEA forecast for 2023-2025 electricity demand: renewables and nuclear meet growth as power-sector emissions hold steady.

✅ Asia drives >70% of demand growth

✅ Renewables and nuclear meet most new supply

✅ CO2 intensity declines; grid flexibility vital


The world’s electricity demand growth slowed only slightly in 2022, despite headwinds from the energy crisis, and is expected to accelerate in the years ahead

Renewables are set to dominate the growth of the world’s electricity supply over the next three years as, renewables eclipse coal in global generation, together with nuclear power they meet the vast majority of the increase in global demand through to 2025, making significant rises in the power sector’s carbon emissions unlikely, according to a new IEA report.

After slowing slightly last year to 2% amid the turmoil of the global energy crisis and exceptional weather conditions in some regions, the growth in world electricity demand is expected to accelerate to an average of 3% over the next three years, the IEA’s Electricity Market Report 2023 finds. Emerging and developing economies in Asia are the driving forces behind this faster pace, which is a step up from average growth of 2.4% during the years before the pandemic and above pre-pandemic levels globally.

More than 70% of the increase in global electricity demand over the next three years is expected to come from China, India and Southeast Asia, as Asia’s power use nears half of the world by mid-decade, although considerable uncertainties remain over trends in China as its economy emerges from strict Covid restrictions. China’s share of global electricity consumption is currently forecast to rise to a new record of one-third by 2025, up from one-quarter in 2015. At the same time, advanced economies are seeking to expand electricity use to displace fossil fuels in sectors such as transport, heating and industry.

“The world’s growing demand for electricity is set to accelerate, adding more than double Japan’s current electricity consumption over the next three years,” said IEA Executive Director Fatih Birol. “The good news is that renewables and nuclear power are growing quickly enough to meet almost all this additional appetite, suggesting we are close to a tipping point for power sector emissions. Governments now need to enable low-emissions sources to grow even faster and drive down emissions so that the world can ensure secure electricity supplies while reaching climate goals.”

While natural gas-fired power generation in the European Union is forecast to fall in the coming years, as wind and solar outpaced gas in 2022, based on current trends, significant growth in the Middle East is set to partly offset this decrease. Sharp spikes in natural gas prices amid the energy crisis have in turn fuelled soaring electricity prices in some markets, particularly in Europe, prompting debate in policy circles over reforms to power market design.

Meanwhile, expected declines in coal-fired generation in Europe and the Americas are likely to be matched by a rise in the Asia-Pacific region, despite increases in nuclear power deployment and restarts of plants in some countries such as Japan. This means that after reaching an all-time high in 2022, carbon dioxide (CO2) emissions from global power generation are set to remain around the same level through 2025.

The strong growth of renewables means their share of the global power generation mix is forecast to rise from 29% in 2022 to 35% in 2025, with the shares of coal- and gas-fired generation falling. As a result, the CO2 intensity of global power generation will continue to decrease in the coming years. Europe bucked this global trend last year, however. The CO2 intensity of Europe’s power generation increased as a result of higher use of coal and gas amid steep drops in output from both hydropower, due to drought, and nuclear power, due to plant closures and maintenance. This setback will be temporary, though, as Europe’s power generation emissions are expected to decrease on average by about 10% a year through 2025.

Electricity demand trends varied widely by region in 2022. India’s electricity consumption rose strongly, while China’s growth was more subdued due to its zero-Covid policy weighing heavily on economic activity. The United States recorded a robust increase in demand, driven by economic activity and higher residential use amid hotter summer weather and a colder-than-normal winter, even as electricity sales projections continue to decline according to some outlooks.

Demand in the European Union contracted due to unusually mild winter weather and a decline in electricity consumption in the industrial sector, which significantly scaled back production because of high energy prices and supply disruptions caused by Russia’s invasion of Ukraine. The 3.5% decrease in EU demand was its second largest percentage decline since the global financial crisis in 2009, with the largest being the exceptional contraction due to the COVID-19 shock in 2020.

The new IEA report notes that electricity demand and supply worldwide are becoming increasingly weather dependent, with extreme conditions a recurring theme in 2022. In addition to the drought in Europe, there were heatwaves in India, resulting in the country’s highest ever peak in power demand. Similarly, central and eastern regions of China were hit by heatwaves and drought, which caused demand for air conditioning to surge amid reduced hydropower generation in Sichuan province. The United States also saw severe winter storms in December, triggering massive power outages.

These highlight the need for faster decarbonisation and accelerated deployment of clean energy technologies, the report says. At the same time, as the clean energy transition gathers pace, the impact of weather events on electricity demand will intensify due to the increased electrification of heating, while the share of weather-dependent renewables will continue to grow in the generation mix. In such a world, increasing the flexibility of power systems, which are under growing strain across grids and markets, while ensuring security of supply and resilience of networks will be crucial.


Related News

View more

Electric vehicles can fight climate change, but they’re not a silver bullet: U of T study

EV Adoption Limits highlight that electric vehicles alone cannot meet emissions targets; life cycle assessment, carbon budgets, clean grids, public transit, and battery materials constraints demand broader decarbonization strategies, city redesign, and active travel.


Key Points

EV Adoption Limits show EVs alone cannot hit climate targets; modal shift, clean grids, and travel demand are essential.

✅ 350M EVs by 2050 still miss 2 C goals without major mode shift

✅ Grid demand rises 41%, requiring clean power and smart charging

✅ Battery materials constraints need recycling, supply diversification


Today there are more than seven million electric vehicles (EVs) in operation around the world, compared with only about 20,000 a decade ago. It’s a massive change – but according to a group of researchers at the University of Toronto’s Faculty of Applied Science & Engineering, it won’t be nearly enough to address the global climate crisis. 

“A lot of people think that a large-scale shift to EVs will mostly solve our climate problems in the passenger vehicle sector,” says Alexandre Milovanoff, a PhD student and lead author of a new paper published in Nature Climate Change. 

“I think a better way to look at it is this: EVs are necessary, but on their own, they are not sufficient.” 

Around the world, many governments are already going all-in on EVs. In Norway, for example, where EVs already account for half of new vehicle sales, the government has said it plans to eliminate sales of new internal combustion vehicles by 2025. The Netherlands aims to follow suit by 2030, with France and Canada's EV goals aiming to follow by 2040. Just last week, California announced plans to ban sales of new internal combustion vehicles by 2035.

Milovanoff and his supervisors in the department of civil and mineral engineering – Assistant Professor Daniel Posen and Professor Heather MacLean – are experts in life cycle assessment, which involves modelling the impacts of technological changes across a range of environmental factors. 

They decided to run a detailed analysis of what a large-scale shift to EVs would mean in terms of emissions and related impacts. As a test market, they chose the United States, which is second only to China in terms of passenger vehicle sales. 

“We picked the U.S. because they have large, heavy vehicles, as well as high vehicle ownership per capita and high rate of travel per capita,” says Milovanoff. “There is also lots of high-quality data available, so we felt it would give us the clearest answers.” 

The team built computer models to estimate how many electric vehicles would be needed to keep the increase in global average temperatures to less than 2 C above pre-industrial levels by the year 2100, a target often cited by climate researchers. 

“We came up with a novel method to convert this target into a carbon budget for U.S. passenger vehicles, and then determined how many EVs would be needed to stay within that budget,” says Posen. “It turns out to be a lot.” 

Based on the scenarios modelled by the team, the U.S. would need to have about 350 million EVs on the road by 2050 in order to meet the target emissions reductions. That works out to about 90 per cent of the total vehicles estimated to be in operation at that time. 

“To put that in perspective, right now the total proportion of EVs on the road in the U.S. is about 0.3 per cent,” says Milovanoff. 

“It’s true that sales are growing fast, but even the most optimistic projections of an electric-car revolution suggest that by 2050, the U.S. fleet will only be at about 50 per cent EVs.” 

The team says that, in addition to the barriers of consumer preferences for EV deployment, there are technological barriers such as the strain that EVs would place on the country’s electricity infrastructure, though proper grid management can ease integration. 

According to the paper, a fleet of 350 million EVs would increase annual electricity demand by 1,730 terawatt hours, or about 41 per cent of current levels. This would require massive investment in infrastructure and new power plants, some of which would almost certainly run on fossil fuels in some regions. 

The shift could also impact what’s known as the demand curve – the way that demand for electricity rises and falls at different times of day – which would make managing the national electrical grid more complex, though vehicle-to-grid strategies could help smooth peaks. Finally, there are technical challenges stemming from the supply of critical materials for batteries, including lithium, cobalt and manganese. 

The team concludes that getting to 90 per cent EV ownership by 2050 is an unrealistic scenario. Instead, what they recommend is a mix of policies, rather than relying solely on a 2035 EV sales mandate as a singular lever, including many designed to shift people out of personal passenger vehicles in favour of other modes of transportation. 

These could include massive investment in public transit – subways, commuter trains, buses – as well as the redesign of cities to allow for more trips to be taken via active modes such as bicycles or on foot. They could also include strategies such as telecommuting, a shift already spotlighted by the COVID-19 pandemic. 

“EVs really do reduce emissions, which are linked to fewer asthma-related ER visits in local studies, but they don’t get us out of having to do the things we already know we need to do,” says MacLean. “We need to rethink our behaviours, the design of our cities, and even aspects of our culture. Everybody has to take responsibility for this.” 

The research received support from the Hatch Graduate Scholarship for Sustainable Energy Research and the Natural Sciences and Engineering Research Council of Canada.


Related News

View more

Sign Up for Electricity Forum’s Newsletter

Stay informed with our FREE Newsletter — get the latest news, breakthrough technologies, and expert insights, delivered straight to your inbox.

Electricity Today T&D Magazine Subscribe for FREE

Stay informed with the latest T&D policies and technologies.
  • Timely insights from industry experts
  • Practical solutions T&D engineers
  • Free access to every issue

Live Online & In-person Group Training

Advantages To Instructor-Led Training – Instructor-Led Course, Customized Training, Multiple Locations, Economical, CEU Credits, Course Discounts.

Request For Quotation

Whether you would prefer Live Online or In-Person instruction, our electrical training courses can be tailored to meet your company's specific requirements and delivered to your employees in one location or at various locations.