CSA Z463 Electrical Maintenance -
Our customized live online or in‑person group training can be delivered to your staff at your location.

- Live Online
- 6 hours Instructor-led
- Group Training Available
Regular Price:
$249
Coupon Price:
$199
WASHINGTON
—
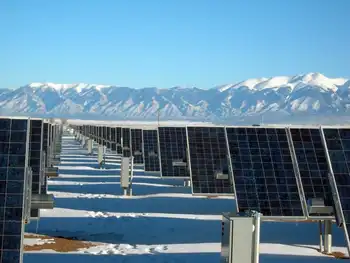
U.S. Solar Panel Shipments 2021 surged to 28.8 million kW of PV modules, tracking utility-scale and small-scale capacity additions, driven by imports from Asia, resilient demand, supply chain constraints, and declining prices.
The Situation Explained
Record 28.8M kW PV modules shipped in 2021; 80% imports; growth in utility- and small-scale capacity with lower prices.
28.8M kW shipped, up from 21.8M kW in 2020 (record capacity)
80% of PV module shipments were imports, mainly from Asia
Utility-scale +13.2 GW; small-scale +5.4 GW; residential led
U.S. shipments of solar photovoltaic (PV) modules (solar panels) rose to a record electricity-generating capacity of 28.8 million peak kilowatts (kW) in 2021, from 21.8 million peak kW in 2020, based on data from our Annual Photovoltaic Module Shipments Report. Continued demand for U.S. solar capacity drove this increase in solar panel shipments in 2021, as solar's share of U.S. electricity continued to rise.
U.S. solar panel shipments include imports, exports, and domestically produced and shipped panels. In 2021, about 80% of U.S. solar panel module shipments were imports, primarily from Asia, even as a proposed tenfold increase in solar aims to reshape the U.S. electricity system.
U.S. solar panel shipments closely track domestic solar capacity additions; differences between the two usually result from the lag time between shipment and installation, and long-term projections for solar's generation share provide additional context. We categorize solar capacity additions as either utility-scale (facilities with one megawatt of capacity or more) or small-scale (largely residential solar installations).
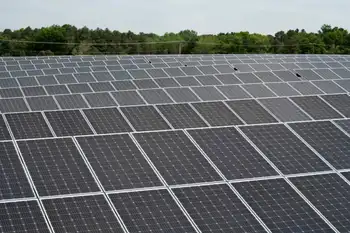
The United States added 13.2 gigawatts (GW) of utility-scale solar capacity in 2021, an annual record and 25% more than the 10.6 GW added in 2020, according to our Annual Electric Generator Report. Additions of utility-scale solar capacity reached a record high, reflecting strong growth in solar and storage despite project delays, supply chain constraints, and volatile pricing.
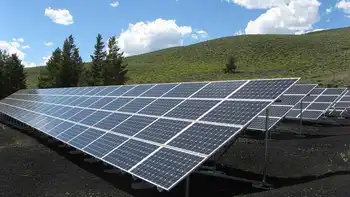
Small-scale solar capacity installations in the United States increased by 5.4 GW in 2021, up 23% from 2020 (4.4 GW), as solar PV and wind power continued to grow amid favorable government plans. Most of the small-scale solar capacity added in 2021 was installed on homes. Residential installations totaled more than 3.9 GW in 2021, compared with 2.9 GW in 2020.
The cost of solar panels has declined significantly since 2010. The average value (a proxy for price) of panel shipments has decreased from $1.96 per peak kW in 2010 to $0.34 per peak kW in 2021, as solar became the third-largest renewable source and markets scaled. Despite supply chain constraints and higher material costs in 2021, the average value of solar panels decreased 11% from 2020.
In 2021, the top five destination states for U.S. solar panel shipments were:
California (5.09 million peak kW)
Texas (4.31 million peak kW)
Florida (1.80 million peak kW)
Georgia (1.15 million peak kW)
Illinois (1.12 million peak kW)
These five states accounted for 46% of all U.S. shipments, and 2023 utility-scale project pipelines point to continued growth.
Related News
Related News

Ottawa to release promised EV sales regulations
Canada ZEV Availability Standard sets EV sales targets and zero-emission mandates, using compliance credits, early…
View more
Green energy in 2023: Clean grids, Alberta, batteries areas to watch
Canada 2023 Clean Energy Outlook highlights decarbonization, renewables, a net-zero grid by 2035, hydrogen, energy…
View more

Canadian electricity associations aligning goals toward net-zero by 2050
Electricity Alliance Canada champions clean power, electrification, and net-zero, uniting renewable energy, hydropower, nuclear, wind,…
View more
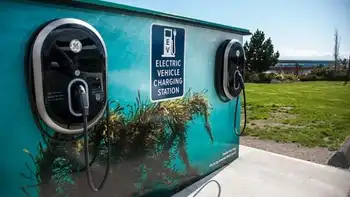
BC's Kootenay Region makes electric cars a priority
Accelerate Kootenays EV charging stations expand along Highway 3, adding DC fast charging and Level…
View more

California's Looming Green New Car Wreck
California Gas Car Ban 2035 signals a shift to electric vehicles, raising grid reliability concerns,…
View more
Biden's proposed tenfold increase in solar power would remake the U.S. electricity system
US Solar Power 2050 Target projects 45% electricity from solar, advancing decarbonization with clean energy,…
View more
Sign Up for Electricity Forum’s Newsletter
Stay informed with our FREE Newsletter — get the latest news, breakthrough technologies, and expert insights, delivered straight to your inbox.
Electricity Today T&D Magazine Subscribe for FREE

Stay informed with the latest T&D policies and technologies.
- Timely insights from industry experts
- Practical solutions T&D engineers
- Free access to every issue

