CSA Z462 Arc Flash Training – Electrical Safety Compliance Course
Our customized live online or in‑person group training can be delivered to your staff at your location.

- Live Online
- 6 hours Instructor-led
- Group Training Available
Regular Price:
$249
Coupon Price:
$199
EDMONTON
—
Canada Clean Electricity Procurement advances federal operations with renewable energy in Alberta, leveraging RECs, competitive sourcing, Indigenous participation, and grid decarbonization to cut greenhouse gas emissions and stimulate new clean power infrastructure.
Main Details
A plan to procure clean power and RECs, cutting emissions in Alberta and attributing use where renewables are absent.
Competitive RFPs to source new clean electricity in Alberta.
Purchase of RECs to attribute clean consumption nationwide.
Long-term PPAs to stimulate net new generation capacity.
Indigenous equity or set-aside participation mandated.
Expected cuts: 133 kt in Alberta, 41 kt across Canada.
Public Services and Procurement Canada (PSPC) is taking concrete steps to meet the Government of Canada's commitment in the Greening Government Strategy to reduce greenhouse gas emissions from federal government buildings, vehicle fleets and other operations, aligning with broader vehicle electrification trends across Canada.
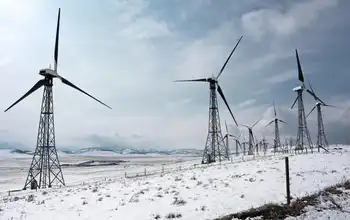
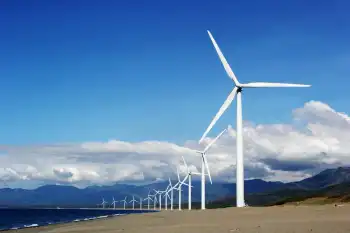
The Honourable Anita Anand, Minister of Public Services and Procurement, announced the Government of Canada has launched Requests for Proposal to buy new clean electricity in the province of Alberta, which is moving ahead with the retirement of coal power to clean its grid, to power federal operations there.
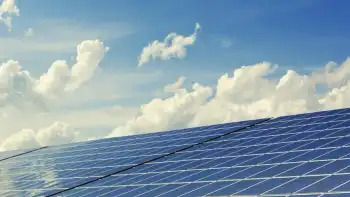
As well, Canada will purchase Renewable Energy Certificates (REC) from new clean energy generation in Canada. This will enable Canada to attribute its energy consumption as clean in regions where new clean renewable sources are not yet available. The Government of Canada is excited about this opportunity to stimulate net new Canadian clean electricity generation through the procurement of RECs and complementary power purchase agreements that secure long-term supply for federal demand.
Together, these contracts will help to ensure Canada is reducing its greenhouse gas footprint by approximately 133 kilotonnes or 56% of total real property emissions in Alberta. Additionally, the contracts will displace approximately 41 kilotonnes of greenhouse gas emissions from electricity use in the rest of Canada, supporting progress toward 2035 clean electricity goals even as challenges remain.
Through these open, fair and transparent competitive procurement processes, PSPC will be a key purchaser of clean electricity and will support the growth of new clean electricity and renewable power infrastructure, such as recent turbine investments in Manitoba that expand capacity.
The Government of Canada's Clean Electricity Initiative plans to use 100% clean electricity by 2022, where available, in alignment with evolving net-zero electricity regulations that shape supply choices, to reduce greenhouse gas emissions and stimulate growth in clean renewable power infrastructure. PSPC has applied the goals of the Government of Canada's Clean Electricity Initiative to its specific requirement for net new clean electricity generation to power federal operations in Alberta.
These procurements will support economic opportunities for Indigenous businesses by encouraging participation in the move towards clean energy, seen in provincial shifts toward clean power in Ontario that broaden markets. Each Request for Proposal incorporates mandatory requirements for Indigenous participation through equity holdings or set-asides under the Procurement Strategy for Aboriginal Business.
Related News
Related News
Canada, Germany to work together on clean energy
Clean Energy Transition spans hydrogen strategies, offshore wind and undersea cables, decarbonization pledges, and net-zero…
View more
UK Renewable energy projects worth billions stuck on hold
UK Renewable Grid Connection Delays threaten the 2035 zero-carbon electricity target as National Grid queues…
View more
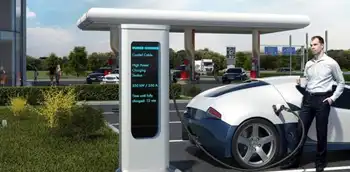
Will EV Supply Miss the Demand Mark in the Short and Medium Term?
EV Carpocalypse signals potential mismatch between electric vehicle production and demand, as charging infrastructure, utility…
View more
'Consumer Reports' finds electric cars really do save money in the long run
Electric Vehicle Ownership Costs include lower maintenance, repair, and fuel expenses; Consumer Reports shows BEV…
View more

US: In 2021, Plug-Ins Traveled 19 Billion Miles On Electricity
US Plug-in EV Miles 2021 highlight BEV and PHEV growth, DOE and Argonne data, 19.1…
View more
Hydro One Networks Inc. - Ivy, ONroute and Canadian Tire make it easy to charge your next road trip
ONroute EV Charging Stations now live on Ontario's Highways 401 and 400, powered by Ivy…
View more
Sign Up for Electricity Forum’s Newsletter
Stay informed with our FREE Newsletter — get the latest news, breakthrough technologies, and expert insights, delivered straight to your inbox.
Electricity Today T&D Magazine Subscribe for FREE

Stay informed with the latest T&D policies and technologies.
- Timely insights from industry experts
- Practical solutions T&D engineers
- Free access to every issue
