0 to 180 km in 10 minutes: B.C. Hydro rolls out faster electric vehicle charging


B.C. Hydro rolls out faster electric vehicle charging

Substation Relay Protection Training

Our customized live online or in‑person group training can be delivered to your staff at your location.

  • Live Online
  • 12 hours Instructor-led
  • Group Training Available
Regular Price:
$699
Coupon Price:
$599
Reserve Your Seat Today

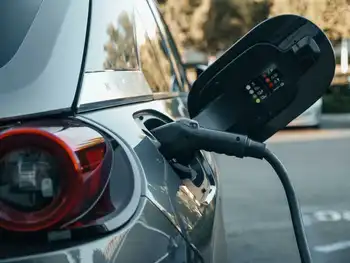
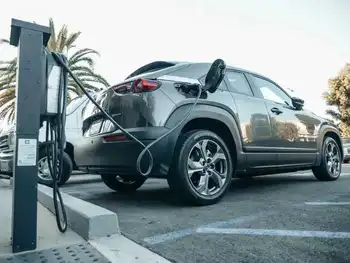
B.C. Hydro fast EV charging stations roll out 180 kW DC fast chargers, power sharing, and rural network expansion in Surrey, Manning Park, Mackenzie, and Tumbler Ridge to ease range anxiety across northern B.C.


Key Points

180 kW DC chargers with power sharing, expanding B.C.'s rural EV network to cut range anxiety and speed up recharging.

✅ 180 kW DC fast charging: ~180 km added in about 10 minutes

✅ Power sharing enables two vehicles to use one unit simultaneously

✅ Expands rural charging coverage to cut range anxiety for northern B.C.


B.C. Hydro has unveiled plans to install new charging stations it says can add as much as 180 kilometres worth of range to the average electric vehicle in 10 minutes.

The utility says the new 180-kilowatt units will be added to its network, expanding stations in southern B.C. as soon as this fall, with even more scheduled to arrive in 2024.

The first communities to get the new faster-charge stations are Surrey, Manning Park and, north of Prince George, Mackenzie and Tumbler Ridge, while the Lillooet fast-charging site is already operational.

B.C. Hydro president Chris O'Riley says both current and prospective electric vehicle owners have said they want improved coverage in more rural parts of the province in order to address range anxiety, as the utility has warned of a potential EV charging bottleneck if demand outpaces infrastructure.

"We are listening to feedback from our customers," he said.

The new stations will also be the first from B.C. Hydro to offer power sharing, which lets two different vehicles use the same unit to charge at the same time.

The adoption of electric vehicles in B.C. is much higher in southern urban areas than rural, northern ones, according to statistics from the provincial government made available in 2022, as the province leads the country in going electric according to recent reports.

The figures showed about one in every 45 people owns a zero-emission vehicle in the southwest regions of the province, but that number drops to one in 232 in the Kootenays, where the region makes electric cars a priority through local initiatives, and one in 414 in northern B.C.

The number of public charging stations closely corresponds to the number of zero-emission vehicles in various regions.

The Vancouver area has more than 500 fast-charging ports, according to ChargeHub, a website that tracks charging stations in North America. 

In contrast, the route from Prince George to Fort Nelson via Dawson Creek along Highway 97, part of the B.C. Electric Highway network connecting the region — a distance of more than 800 kilometres — has just three locations where a vehicle can be charged to 80 per cent power in an hour or less, creating challenges for people hoping to travel the route.

The disparity is also clear in a just-published analysis from the non-profit Community Energy Association, which acts as an advisory group to government associations. 

It found that while there is roughly one charging port every three square kilometres in Metro Vancouver, the number drops to one every 250 square kilometres in the Regional District of East Kootenay and one every 3,500 square kilometres in the Peace River Regional District, in the province's northeast.

"The more infrastructure we can get across the region ... the more the adoption of electric vehicles will increase," said the association's director of transportation initiatives, Danielle Weiss.

"We are excited to hear that B.C. Hydro is also viewing rural areas as a key focus for their new, enhanced charging technology."

B.C. Hydro says it currently has 153 charging units at 84 locations across the province with plans to add an additional 3,000 ports over the next 10 years, with provincial EV charger rebates supporting home and workplace installations as well.


Related News

Related News

California Takes the Lead in Electric Vehicle and Charging Station Adoption

California EV Adoption leads the U.S., with 37% of registered electric vehicles and 27% of charging locations, spanning Level 1, Level 2, and DC Fast stations, aligned with OCPI and boosted by CALeVIP funding.


Key Points

California EV adoption reflects the state's leading EV registrations and growth in private charging infrastructure.

✅ 37% of U.S. EVs, 27% of charging locations in 2022

✅ CALeVIP funding boosts public charging deployment

✅ OCPI-aligned data; EVs per charger rose to 75 in CA


California has consistently been at the forefront of electric vehicle (EV) adoption, with EV sales topping 20% in California underscoring this trend, and the proliferation of EV charging stations in the United States, maintaining this position since 2016. According to recent estimates from our State Energy Data System (SEDS), California accounts for 37% of registered light-duty EVs in the U.S. and 27% of EV charging locations as of the end of 2022.

The vehicle stock data encompass all registered on-road, light-duty vehicles and exclude any previous vehicle sales no longer in operation. The data on EV charging locations include both private and public access stations for Legacy, Level 1, Level 2, and DC Fast charging ports, excluding EV chargers in single-family residences. There is a data series break between 2020 and 2021, when the U.S. Department of Energy updated its data to align with the Open Charge Point Interface (OCPI) international standard, reflecting changes in the U.S. charging infrastructure landscape.

In 2022, the number of registered EVs in the United States, with U.S. EV sales soaring into 2024 nationwide, surged to six times its 2016 figure, growing from 511,600 to 3.1 million, while the number of U.S. charging locations nearly tripled, rising from 19,178 to 55,015. Over the same period, California saw its registered EVs more than quadruple, jumping from 247,400 to 1.1 million, and its charging locations tripled, increasing from 5,486 to 14,822.

California's share of U.S. EV registrations has slightly decreased in recent years as EV adoption has spread across the country, with Arizona EV ownership relatively high as well. In 2016, California accounted for approximately 48% of light-duty EVs in the United States, which was approximately 12 times more than the state with the second-highest number of EVs, Georgia. By 2022, California's share had decreased to around 37%, which was still approximately six times more than the state with the second-most EVs, Florida.

On the other hand, California's share of U.S. EV charging locations has risen slightly in recent years, as charging networks compete amid federal electrification efforts and partly due to the California Electric Vehicle Infrastructure Project (CALeVIP), which provides funding for the installation of publicly available EV charging stations. In 2016, approximately 25% of U.S. EV charging locations were in California, over four times as many as the state with the second-highest number, Texas. In 2022, California maintained its position with over four times as many EV charging locations as the state with the second-most, New York.

The growth in the number of registered EVs has outpaced the growth of EV charging locations in the United States, and in 2021 plug-in vehicles traveled 19 billion electric miles nationwide, underscoring utilization. In 2016, there were approximately 27 EVs per charging location on average in the country. Alaska had the highest ratio, with 67 EVs per charging location, followed by California with 52 vehicles per location.

In 2022, the average ratio was 55 EVs per charging location in the United States, raising questions about whether the grid can power an ongoing American EV boom ahead. New Jersey had the highest ratio, with 100 EVs per charging location, followed by California with 75 EVs per location.


Related News

View more

B.C. expands EV charging, leads country in going electric

BC EV Charging Network Funding accelerates CleanBC goals with new public fast-charging stations, supporting ZEV adoption, the Electric Highway, and rebates, lowering fuel costs and emissions across British Columbia under the Clean Transportation Action Plan.


Key Points

Funding to expand fast-charging stations, grow ZEV adoption, and advance CleanBC and the Electric Highway.

✅ $26M funds ~250 public fast-charging stations.

✅ Supports Electric Highway and remote access.

✅ Drives ZEV sales under CleanBC targets.


As British Columbians are embracing zero-emission vehicles faster than any other jurisdiction in Canada, the Province is helping them go electric with new incentives and $26 million in new funding for public charging stations.

“British Columbians are switching to clean energy and cleaner transportation in record numbers as part of our CleanBC plan and leading Canada in the transition to zero emission vehicles,” said Josie Osborne, Minister of Energy, Mines and Low Carbon Innovation, on Tuesday. “The new funding we are announcing today to expand B.C.’s public charging network will help get more EVs on the road, reduce our reliance on fossil fuels, and lower fuel costs for people.”

The Province’s newly released annual report about zero-emission vehicles (ZEV) shows they represented 18.1% of new light-duty passenger vehicles sold in 2022 – the highest percentage for any province or territory. To support British Columbians’ transition to electric vehicles and to help industry lower its emissions, year-end funding of $26 million will go toward the CleanBC Public Charging Program for light-duty vehicle charging.

The new funding will support approximately 250 more public light-duty fast-charging stations, including stations to complete the B.C. Electric Highway, a CleanBC Roadmap to 2030 commitment that will make recharging easier in every corner of the province.

The 2022 ZEV Update report highlights CleanBC Go Electric rebates and programs that have helped drive growth in the number of electric vehicles in B.C. The number of registered light-duty EVs rose from 5,000 in 2016 to more than 100,000 today – a 1,900% increase in the past six years. Last year, 30,004 zero-emission vehicles were bought in B.C., beating the previous record of 24,263 in 2021.

In addition, the report outlines progress in the installation of public charging stations across British Columbia, supported by B.C. Hydro expansion, which now has one of the largest public charging networks in Canada, with more than 3,800 charging stations at the end of 2022. That compares to just 781 charging stations in 2016.

The CleanBC Roadmap to 2030, released in 2021, details a range of expanded actions to accelerate the switch to cleaner transportation, including strengthening the Zero-Emission Vehicles Act to require 26% of light-duty vehicle sales to be ZEV by 2026, 90% by 2030 and 100% by 2035 – five years ahead of the original target, and implementing the Clean Transportation Action Plan.

George Heyman, Minister of Environment and Climate Change Strategy, said: “Transportation accounts for about 40% of emissions in B.C., which is why we are committed to accelerating requirements for ZEVs and setting new standards for medium- and heavy-duty vehicles. To support this uptake, we continue to expand B.C.’s electric vehicle charging network, including faster EV charging options, with a target of having 10,000 public EV charging stations by 2030.”

Blair Qualey, President and CEO, New Car Dealers Association of BC, said: “B.C.’s new car dealers are proud to be involved in a true partnership that has been so instrumental in B.C. establishing and maintaining a leadership position in zero-emission vehicle adoption. Ongoing investments that continue to support the CleanBC Go Electric rebate program, including home and workplace charging rebates, and the availability of adequate charging infrastructure for consumers and businesses will be critical to the Province meeting its ZEV mandate targets, while also creating the promise of a greener and stronger economic future for British Columbians.”

Harry Constantine, President, Vancouver Electric Vehicle Association, said: “Expanding the buildout of the Electric Highway and establishing a network of charging stations are critical steps for moving the adoption of electric vehicles forward as demand ramps up across B.C. This stands to benefit all British Columbians, including remote communities. We are very pleased to see the Province investing in these measures.”


Related News

View more

CO2 output from making an electric car battery isn't equal to driving a gasoline car for 8 years

EV Battery Manufacturing Emissions debunk viral claims with lifecycle analysis, showing lithium-ion production CO2 depends on grid mix and is offset by zero tailpipe emissions and renewable-energy charging over typical vehicle miles.


Key Points

EV lithium-ion pack production varies by grid mix; ~1-2 years of driving, then offset by zero tailpipe emissions.

✅ Battery CO2 depends on electricity mix and factory efficiency.

✅ 75 kWh pack ~4.5-7.5 t CO2; not equal to 8 years of driving.

✅ Lifecycle analysis: EVs cut GHG vs gas, especially with renewables.


Electric vehicles are touted as an environmentally friendly alternative to gasoline powered cars, but one Facebook post claims that the benefits are overblown, despite fact-checks of charging math to the contrary, and the vehicles are much more harmful to the planet than people assume.

A cartoon posted to Facebook on April 29, amid signs the EV era is arriving in many markets, shows a car in one panel with "diesel" written on the side and the driver thinking "I feel so dirty." In another panel, a car has "electric" written on its side with the driver thinking "I feel so clean."

However, the electric vehicle is shown connected to what appears to be a factory that’s blowing dark smoke into the air.

Below the cartoon is a caption that claims "manufacturing the battery for one electric car produces the same amount of CO2 as running a petrol car for eight years."

This isn’t a new line of criticism against electric vehicles, and reflects ongoing opinion on the EV revolution in the media. Similar Facebook posts have taken aim at the carbon dioxide produced in the manufacturing of electric cars — specifically the batteries — to make the case that zero emissions vehicles aren’t necessarily clean.

Full electric vehicles require a large lithium-ion battery to store energy and power the motor that propels the car, according to Insider. The lithium-ion battery packs in an electric car are chemically similar to the ones found in cell phones and laptops.

Because they require a mix of metals that need to be extracted and refined, lithium-ion batteries take more energy to produce than the common lead-acid batteries used in gasoline cars to help start the engine.

How much CO2 is emitted in the production depends on where the lithium-ion battery is made — or specifically, how the electricity powering the factory is generated, and national electricity profiles such as Canada's 2019 mix help illustrate regional differences — according to Zeke Hausfather, a climate scientist and director of climate and energy at the Breakthrough Institute, an environmental research think tank.

Producing a 75 kilowatt-hour battery for a Tesla Model 3, considered on the larger end of batteries for electric vehicles, would result in the emission of 4,500 kilograms of CO2 if it was made at Tesla's battery factory in Nevada. That’s the emissions equivalent to driving a gas-powered sedan for 1.4 years, at a yearly average distance of 12,000 miles, Hausfather said.

If the battery were made in Asia, manufacturing it would produce 7,500 kg of carbon dioxide, or the equivalent of driving a gasoline-powered sedan for 2.4 years — but still nowhere near the eight years claimed in the Facebook post. Hausfather said the larger emission amount in Asia can be attributed to its "higher carbon electricity mix." The continent relies more on coal for energy production, while Tesla’s Nevada factory uses some solar energy. 

"More than half the emissions associated with manufacturing the battery are associated with electricity use," Hausfather said in an email to PolitiFact. "So, as the electricity grid decarbonizes, emissions associated with battery production will decline. The same is not true for sedan tailpipe emissions."

The Facebook post does not mention the electricity needs and CO2 impact of factories that build gasoline or diesel cars and their components. 

Another thing the Facebook post omits is that the CO2 emitted in the production of the battery can be offset over a short time in an electric car by the lack of tailpipe emissions when it’s in operation. 

The Union of Concerned Scientists found in a 2015 report that taking into account electricity sources for charging, which have become greener in all states since then, an electric vehicle ends up reducing greenhouse gas emissions by about 50% compared with a similar size gas-powered car.

A midsize vehicle completely negates the carbon dioxide its production emits by the time it travels 4,900 miles, according to the report. For full size cars, it takes 19,000 miles of driving.

The U.S. Energy Department’s Office of Energy Efficiency and Renewable Energy also looked at the life cycle of electric vehicles — which includes a car’s production, use and disposal — and concluded they produce less greenhouse gases and smog than gasoline-powered vehicles, a conclusion consistent with independent analyses from consumer and energy groups.

The agency also found drivers could further lower CO2 emissions by charging with power generated by a renewable energy source, and drivers can also save money in the long run with EV ownership. 

Our ruling
A cartoon shared on Facebook claims the carbon dioxide emitted from the production of one electric car battery is the equivalent to driving a gas-powered vehicle for eight years.

The production of lithium-ion batteries for electric cars emits a significant amount of carbon dioxide, but nowhere near the level claimed in the cartoon. The emissions from battery production are equivalent to driving a gasoline car for one or two years, depending on where it’s produced, and those emissions are effectively offset over time by the lack of tailpipe emissions when the car is on the road. 

We rate this claim Mostly False.    


Related News

View more

NREL’s Electric Vehicle Infrastructure Projection Tool Helps Utilities, Agencies, and Researchers Predict Hour-by-Hour Impact of Charging on the Grid

EVI-Pro Lite EV Load Forecasting helps utilities model EV charging infrastructure, grid load shapes, and resilient energy systems, factoring home, workplace, and public charging behavior to inform planning, capacity upgrades, and flexible demand strategies.


Key Points

A NREL tool projecting EV charging demand and load shapes to help utilities plan the grid and right-size infrastructure.

✅ Visualizes weekday/weekend EV load by charger type.

✅ Tests home, workplace, and public charging access scenarios.

✅ Supports utility planning, demand flexibility, and capacity upgrades.


As electric vehicles (EVs) continue to grow in popularity, utilities and community planners are increasingly focused on building resilient energy systems that can support the added electric load from EV charging, including a possible EV-driven demand increase across the grid.

But forecasting the best ways to adapt to increased EV charging can be a difficult task as EV adoption will challenge state power grids in diverse ways. Planners need to consider when consumers charge, how fast they charge, and where they charge, among other factors.

To support that effort, researchers at the National Renewable Energy Laboratory (NREL) have expanded the Electric Vehicle Infrastructure Projection (EVI-Pro) Lite tool with more analytic capabilities. EVI-Pro Lite is a simplified version of EVI-Pro, the more complex, original version of the tool developed by NREL and the California Energy Commission to inform detailed infrastructure requirements to support a growing EV fleet in California, where EVs bolster grid stability through coordinated planning.

EVI-Pro Lite’s estimated weekday electric load by charger type for El Paso, Texas, assuming a fleet of 10,000 plug-in electric vehicles, an average of 35 daily miles traveled, and 50% access to home charging, among other variables, as well as potential roles for vehicle-to-grid power in future scenarios. The order of the legend items matches the order of the series stacked in the chart.

Previously, the tool was limited to letting users estimate how many chargers and what kind of chargers a city, region, or state may need to support an influx of EVs. In the added online application, those same users can take it a step further to predict how that added EV charging will impact electricity demand, or load shapes, in their area at any given time and inform grid coordination for EV flexibility strategies.

“EV charging is going to look different across the country, depending on the prevalence of EVs, access to home charging, and the kind of chargers most used,” said Eric Wood, an NREL researcher who led model development. “Our expansion gives stakeholders—especially small- to medium-size electric utilities and co-ops—an easy way to analyze key factors for developing a flexible energy strategy that can respond to what’s happening on the ground.”

Tools to forecast EV loads have existed for some time, but Wood said that EVI-Pro Lite appeals to a wider audience, including planners tracking EVs' impact on utilities in many markets. The tool is a user-friendly, free online application that displays a clear graphic of daily projected electric loads from EV charging for regions across the country.

After selecting a U.S. metropolitan area and entering the number of EVs in the light-duty fleet, users can change a range of variables to see how they affect electricity demand on a typical weekday or weekend. Reducing access to home charging by half, for example, results in higher electric loads earlier in the day, although energy storage and mobile charging can help moderate peaks in some cases. That is because under such a scenario, EV owners might rely more on public or workplace charging instead of plugging in at home later in the evening or at night.

“Our goal with the lite version of EVI-Pro is to make estimating loads across thousands of scenarios fast and intuitive,” Wood said. “And if utilities or stakeholders want to take that analysis even deeper, our team at NREL can fill that gap through partnership agreements, too. The full version of EVI-Pro can be tailored to develop detailed studies for individual planners, agencies, or utilities.”


Related News

View more

Canadian climate policy and its implications for electricity grids

Canada Electricity Decarbonization Costs indicate challenging greenhouse gas reductions across a fragmented grid, with wind, solar, nuclear, and natural gas tradeoffs, significant GDP impacts, and Net Zero targets constrained by intermittency and limited interties.


Key Points

Costs to cut power CO2 via wind, solar, gas, and nuclear, considering grid limits, intermittency, and GDP impacts.

✅ Alberta model: eliminate coal; add wind, solar, gas; 26-40% CO2 cuts

✅ Nuclear option enables >75% cuts at higher but feasible system costs

✅ National costs 1-2% GDP; reserves, transmission, land, and waste not included


Along with many western developed countries, Canada has pledged to reduce its greenhouse gas emissions by 40–45 percent by 2030 from 2005 emissions levels, and to achieve net-zero emissions by 2050.

This is a huge challenge that, when considered on a global scale, will do little to stop climate change because emissions by developing countries are rising faster than emissions are being reduced in developed countries. Even so, the potential for achieving emissions reduction targets is extremely challenging as there are questions as to how and whether targets can be met and at what cost. Because electricity can be produced from any source of energy, including wind, solar, geothermal, tidal, and any combustible material, climate change policies have focused especially on nations’ electricity grids, and in Canada cleaning up electricity is viewed as critical to meeting climate pledges.

Canada’s electricity grid consists of ten separate provincial grids that are weakly connected by transmission interties to adjacent grids and, in some cases, to electricity systems in the United States. At times, these interties are helpful in addressing small imbalances between electricity supply and demand so as to prevent brownouts or even blackouts, and are a source of export revenue for provinces that have abundant hydroelectricity, such as British Columbia, Manitoba, and Quebec.

Due to generally low intertie capacities between provinces, electricity trade is generally a very small proportion of total generation, though electricity has been a national climate success in recent years. Essentially, provincial grids are stand alone, generating electricity to meet domestic demand (known as load) from the lowest cost local resources.

Because climate change policies have focused on electricity (viz., wind and solar energy, electric vehicles), and Canada will need more electricity to hit net-zero according to the IEA, this study employs information from the Alberta electricity system to provide an estimate of the possible costs of reducing national CO2 emissions related to power generation. The Alberta system serves as an excellent case study for examining the potential for eliminating fossil-fuel generation because of its large coal fleet, favourable solar irradiance, exceptional wind regimes, and potential for utilizing BC’s reservoirs for storage.

Using a model of the Alberta electricity system, we find that it is infeasible to rely solely on renewable sources of energy for 100 percent of power generation—the costs are prohibitive. Under perfect conditions, however, CO2 emissions from the Alberta grid can be reduced by 26 to 40 percent by eliminating coal and replacing it with renewable energy such as wind and solar, and gas, but by more than 75 percent if nuclear power is permitted. The associated costs are estimated to be some $1.4 billion per year to reduce emissions by at most 40 percent, or $1.9 billion annually to reduce emissions by 75 percent or more using nuclear power (an option not considered feasible at this time).

Based on cost estimates from Alberta, and Ontario’s experience with subsidies to renewable energy, and warnings that the switch from fossil fuels to electricity could cost about $1.4 trillion, the costs of relying on changes to electricity generation (essentially eliminating coal and replacing it with renewable energy sources and gas) to reduce national CO2 emissions by about 7.4 percent range from some $16.8 to $33.7 billion annually. This constitutes some 1–2 percent of Canada’s GDP.

The national estimates provided here are conservative, however. They are based on removing coal-fired power from power grids throughout Canada. We could not account for scenarios where the scale of intermittency turned out worse than indicated in our dataset—available wind and solar energy might be lower than indicated by the available data. To take this into account, a reserve market is required, but the costs of operating such a capacity market were not included in the estimates provided in this study. Also ignored are the costs associated with the value of land in other alternative uses, the need for added transmission lines, environmental and human health costs, and the life-cycle costs of using intermittent renewable sources of energy, including costs related to the disposal of hazardous wastes from solar panels and wind turbines.


Related News

View more

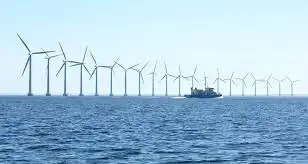
Translation: Wind energy at sea in Europe

Nature-friendly offshore wind energy supports climate neutrality by reducing greenhouse gases while safeguarding marine biodiversity through EU marine spatial planning, ecosystem-based approaches, cross-border coordination, and zero-use zones for resilient seas.


Key Points

An approach to offshore wind that cuts emissions while respecting ecological limits and protecting marine biodiversity.

✅ Aligns buildout with ecological limits and marine spatial plans

✅ Minimizes noise, collision, and habitat loss for sensitive species

✅ Coordinates EU-wide monitoring, data, and cross-border siting


Offshore wind power can help reduce greenhouse gas emissions, but it poses risks for the seas. Germany will hold the EU Council Presidency and the North Sea Energy Cooperation Presidency in 2020. What must be done to contain the climate and species crises, as it were?

Offshore wind power is an important regenerative energy source with a $1 trillion market outlook in the coming decades. However, the construction, operation and maintenance of the systems put marine mammals, birds and fish at considerable risk. Photo: Siemens AG

In order to achieve the German and EU climate and energy goals by 2030 and climate neutrality by 2050, we need a nature-friendly energy transition. At present, the European energy system is largely based on fossil fuels. This is changing, as renewables surge across Europe for end consumers and industry and the large-scale electrification of the energy consumption sectors. Offshore wind energy is an element for future power generation.

A nature-friendly energy transition is only possible if energy consumption is reduced and energy efficiency is maximized in all applications and sectors. Emissions reductions through offshore wind energy In 2019, Europe had an installed offshore wind energy capacity of around 22 gigawatts from 5,047 grid-connected wind turbines in twelve countries. In Germany, the nominal output of the offshore wind turbines feeding into the German power grid was around 7.5 gigawatts, with clean energy accounting for about 50% of electricity nationwide. The wind blows much stronger and more steadily at sea than on land.

The power capacity of the turbines has also almost doubled in the last five years, which has led to a higher energy yield. Offshore wind energy is a building block for replacing fossil fuels, and markets like the U.S. offshore sector are about to soar as well. Wind turbines at sea provide electricity almost every hour of the year and have operating hours that are as high as conventional power plants. They can contribute to significant reductions in CO2 emissions and to mitigate the climate crisis.

It must be ensured that offshore wind turbines and parks as well as the grid infrastructure make a positive contribution to climate protection through their expansion and that the overall condition of marine ecosystems improves. The expansion of offshore wind energy is necessary from the point of view of climate science and must take place within the framework of the ecological load limits and under nature conservation aspects.

Seas and marine ecosystems suffer from years of overfishing, pollution and industrial use. The conservation status of sea birds, marine mammals and fish stocks is poor. Ecosystem services and productivity of the oceans are decreasing as a result of massive species extinction and unfavorable habitats. Changes in sea temperature, oxygen levels and acidification of the oceans reduce their resilience to the climate crisis.

The latest reports from the European Environment Agency show in black and white that the good environmental status and other goals of the Marine Strategy Framework Directive are not being achieved. The primary goal must therefore be to meet the obligations of the Marine Strategy Framework Directive and the EU nature conservation directives.

With the expansion of offshore wind energy, the pressure on the already polluted marine ecosystems is increasing. Offshore wind turbines also harbor risks for marine ecosystems, especially if they are built in unfavorable locations. Studies show harmful effects on marine mammals, birds, fish and the ocean floor. In Europe, where wind power investments hit $29.4 billion last year, a regulatory framework must be created for the expansion of offshore wind energy within the ecological limits and taking into account zero-use zones. The European Union urgently needs to take coherent measures for healthy and resilient seas.

New strategy of the European Commission The EU Commission plans to present a strategy for the expansion of renewable energies at sea on November 18, 2020.

The strategy will address the opportunities and challenges associated with the expansion of renewable energies at sea, such as effects on energy networks and markets, management of the maritime space, the technological transfer of research projects, regional and international cooperation and industrial policy dimensions, as well as political headwinds in some countries that can affect project pipelines. NABU welcomes the strategy, but worries about insufficient consideration of marine protection, ecological load-bearing capacity and the marine spatial planning that regulates interests in the use of the sea. All EU member states have to submit their marine spatial planning plans by March 2021.

Conclusions of the European Council Shortly before the end of 2020, the European Council plans to adopt conclusions for cooperation among European member states on the subject of offshore wind energy and other renewable energy sources at sea. It is important that the planning and development of offshore wind energy is coordinated across national borders, including alignment with the UK's offshore wind growth, also to protect marine ecosystems.

However, the ecosystem approach must not be left out. It must be ensured that the Council conclusions focus on the implementation of EU marine and nature conservation directives for the expansion of offshore wind energy within the load limits. EU-wide monitoring systems can help protect marine species and ecosystems. Germany holds the EU Council Presidency and the North Sea Energy Cooperation Presidency for 2020 and can make a decisive contribution.

NABU demands on offshore wind energy in Europe Expansion targets for offshore wind energy across Europe should be based on the ecological load limits of the seas. Development of concrete concepts for the ecological upgrading of areas in marine spatial planning and operationalization of the ecosystem-based approach.

For the nature-friendly expansion of offshore – Wind energy systems must take into account avoidance distances from seabirds to turbines, habitat loss, collision risks and cumulative effects. Implementation / obligation to sensitivity analyzes – they allow targeted conclusions about the best possible locations for offshore wind energy without conflicts with marine protection.

Targeted keeping of areas free for species and their Habitats of anthropogenic use – this increases planning security and can lower investment thresholds for EU funding programs. Ensuring regional cooperation between the European member states for nature Protection and with the involvement of nature conservation authorities – after all, the marine ecosystem does not stop at borders.

Adjustment of priorities: If offshore wind energy is prioritized over other renewable energy sources across Europe, other industrial forms of use of the seas must be given a lower priority.


Related News

View more

Sign Up for Electricity Forum’s Newsletter

Stay informed with our FREE Newsletter — get the latest news, breakthrough technologies, and expert insights, delivered straight to your inbox.

Electricity Today T&D Magazine Subscribe for FREE

Stay informed with the latest T&D policies and technologies.
  • Timely insights from industry experts
  • Practical solutions T&D engineers
  • Free access to every issue

Download the 2025 Electrical Training Catalog

Explore 50+ live, expert-led electrical training courses –

  • Interactive
  • Flexible
  • CEU-cerified