Substation Relay Protection Training
Our customized live online or in‑person group training can be delivered to your staff at your location.

- Live Online
- 12 hours Instructor-led
- Group Training Available
Regular Price:
$699
Coupon Price:
$599
SAN FRANCISCO
—
CAISO Renewable Curtailments reflect grid balancing under transmission congestion and oversupply, reducing solar and wind output while leveraging WEIM trading, battery storage, and transmission expansion to integrate renewables and stabilize demand-supply.
The Important Points
CAISO renewable curtailments are reductions in wind and solar output to balance grid amid congestion or oversupply.
Driven mainly by transmission congestion since 2019
Oversupply in mild spring midday hours boosts solar curtailments
2.4 million MWh curtailed in 2022; >2.3 million MWh by Sep 2023
WEIM trades avoided curtailments; day-ahead market due in 2025
Batteries and 45 new transmission projects reduce curtailment risk
The California Independent System Operator (CAISO), the grid operator for most of the state, is increasingly curtailing solar- and wind-powered electricity generation, as reported in rising curtailments, as it balances supply and demand during the rapid growth of wind and solar power in California.
Grid operators must balance supply and demand to maintain a stable electric system as advances in solar and wind continue to scale. The output of wind and solar generators are reduced either through price signals or rarely, through an order to reduce output, during periods of:
Congestion, when power lines don’t have enough capacity to deliver available energy
Oversupply, when generation exceeds customer electricity demand
In CAISO, curtailment is largely a result of congestion. Congestion-related curtailments have increased significantly since 2019 because California's solar boom has been outpacing upgrades in transmission capacity.
In 2022, CAISO curtailed 2.4 million megawatthours (MWh) of utility-scale wind and solar output, a 63% increase from the amount of electricity curtailed in 2021. As of September, CAISO has curtailed more than 2.3 million MWh of wind and solar output so far this year, even as the US project pipeline is dominated by wind, solar, and batteries.
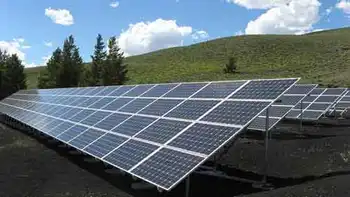
Solar accounts for almost all of the energy curtailed in CAISO—95% in 2022 and 94% in the first seven months of 2023. CAISO tends to curtail the most solar in the spring when electricity demand is relatively low (because moderate spring temperatures mean less demand for space heating or air conditioning) and solar output is relatively high, although wildfire smoke impacts can reduce available generation during fire season as well.
CAISO has increasingly curtailed renewable generation as renewable capacity has grown in California, and the state has even experienced a near-100% renewables moment on the grid in recent years. In 2014, a combined 9.0 gigawatts (GW) of wind and solar capacity had been built in California. As of July 2023, that number had grown to 17.6 GW. Developers plan to add another 3.0 GW by the end of 2024.
CAISO is exploring and implementing various solutions to its increasing curtailment of renewables, including:
The Western Energy Imbalance Market (WEIM) is a real-time market that allows participants outside of CAISO to buy and sell energy to balance demand and supply. In 2022, more than 10% of total possible curtailments were avoided by trading within the WEIM. A day ahead market is expected to be operational in Spring 2025.
CAISO is expanding transmission capacity to reduce congestion. CAISO’s 2022–23 Transmission Planning Process includes 45 transmission projects to accommodate load growth and a larger share of generation from renewable energy sources.
CAISO is promoting the development of flexible resources that can quickly respond to sudden increases and decreases in demand such as battery storage technologies that are rapidly becoming more affordable. California has 4.9 GW of battery storage, and developers plan to add another 7.6 GW by the end of 2024, according to our survey of recent and planned capacity changes. Renewable generators can charge these batteries with electricity that would otherwise have been curtailed.
Related News
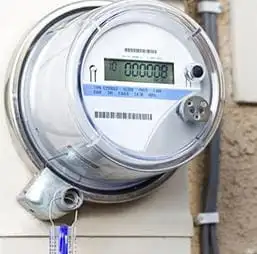
California introduces new net metering regime
California NEM-3 Tariff ushers a successor Net Energy Metering framework, revising export compensation, TOU rates,…
View more
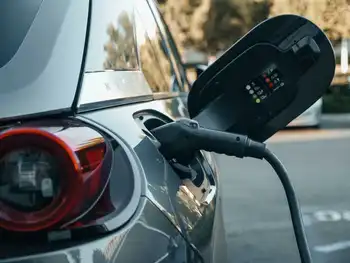
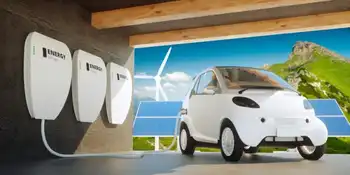
0 to 180 km in 10 minutes: B.C. Hydro rolls out faster electric vehicle charging
B.C. Hydro fast EV charging stations roll out 180 kW DC fast chargers, power sharing,…
View more
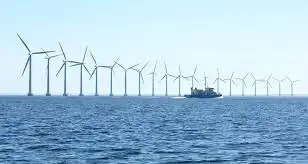
Translation: Wind energy at sea in Europe
Nature-friendly offshore wind energy supports climate neutrality by reducing greenhouse gases while safeguarding marine biodiversity…
View more
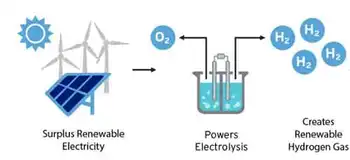
What to know about DOE's hydrogen hubs
U.S. Clean Hydrogen Hubs aim to scale production, storage, transport, and use as DOE and…
View more
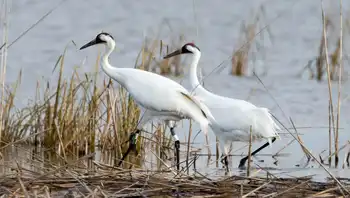
Whooping cranes steer clear of wind turbines when selecting stopover sites
Whooping crane migration near wind turbines shows strong avoidance of stopover habitat within 5 km,…
View more
NREL’s Electric Vehicle Infrastructure Projection Tool Helps Utilities, Agencies, and Researchers Predict Hour-by-Hour Impact of Charging on the Grid
EVI-Pro Lite EV Load Forecasting helps utilities model EV charging infrastructure, grid load shapes, and…
View more
Sign Up for Electricity Forum’s Newsletter
Stay informed with our FREE Newsletter — get the latest news, breakthrough technologies, and expert insights, delivered straight to your inbox.
Electricity Today T&D Magazine Subscribe for FREE

Stay informed with the latest T&D policies and technologies.
- Timely insights from industry experts
- Practical solutions T&D engineers
- Free access to every issue

