
NFPA 70b Training - Electrical Maintenance
Our customized live online or in‑person group training can be delivered to your staff at your location.

- Live Online
- 12 hours Instructor-led
- Group Training Available
Regular Price:
$699
Coupon Price:
$599
BEIJING
—
Dewa-China Renewable Energy Partnership advances solar, clean energy, smart grid, 5G, cloud, and Big Data, linking Dewa with Hanergy and Huawei for R&D, smart meters, demand management, and resilient network infrastructure.
The Big Picture
A Dewa collaboration with Hanergy and Huawei to co-develop solar, smart grid, 5G, cloud, and resilient utility networks.
Focus on solar integration, micro-grids, and smart metering.
Builds on DEWA-Hanergy MoU; explores joint investment models.
Huawei R&D joint projects on network automation and resilience.
Aligns with Asian grid modernization and U.S. funding trends.
A high-level delegation from Dubai Electricity and Water Authority (Dewa) recently visited China in bid to build closer ties with Chinese renewable and clean energy and smart services and smart grid companies, amid broader power grid modernization in Asia trends.
The team led by the managing director and CEO Saeed Mohammed Al Tayer visited the headquarters of Hanergy Holding Group, one of the largest international companies in alternative and renewable energy, in Beijing.
The visit complements the co-operation between Dewa and Hanergy after the signing MoU between the two sides last May, said a statement from Dewa.
The two parties focused on renewable and clean energy and its development, including efforts to integrate solar into the grid through advanced programs, and enhancing opportunities for joint investment.
Al Tayer also visited the Exhibition Hall and Exhibition Centre of the Hanergy Clean Energy Exhibition spread over a 7,000-sq-m area at the Beijing Olympic Park.
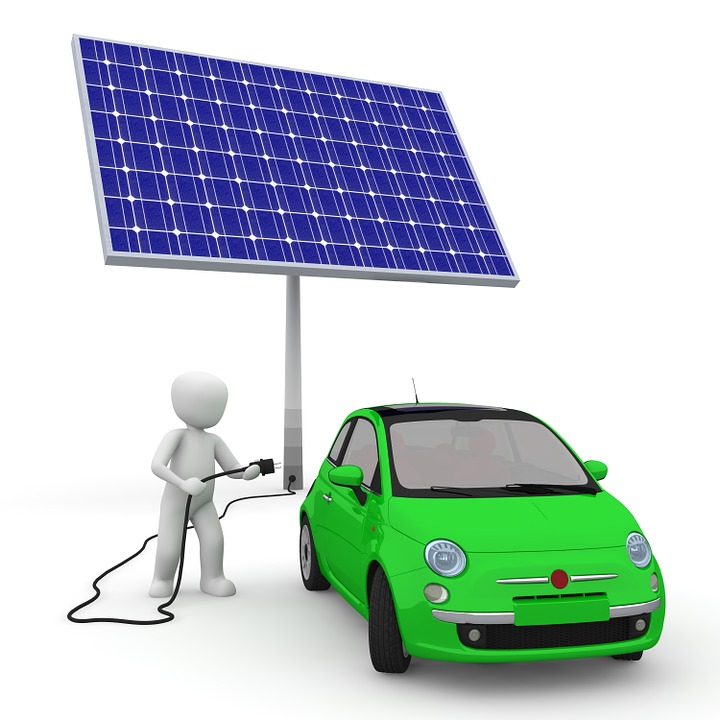
He discussed solar power technologies and applications, which included integrated photovoltaic panels and their distribution on the roofs of industrial and residential buildings, residential and mobile power systems, micro-grid installations in remote regions, solar-powered vehicles, and various elements of the exhibition.
Al Tayer and the accompanying delegation later visited the Beijing R&D Centre, which is one of Huaweis largest research institutes, known for Huawei smart grid initiatives across global markets, that employs over 12,000 people. The centre covers the latest pre-5G solutions, Cloud, Big Data, as well as vertical solutions for a smart and safe city.
"The visit is part of a joint venture with Huawei, which includes R&D projects to develop smart network infrastructures and various mechanisms and technologies, aligned with recent U.S. grid improvement funding initiatives, such as smart meters for electricity and water services, energy demand management, and self-recovery mechanisms from errors and disasters," he added.
Related News
Related News
Power Outage in Northeast D.C.
Northeast D.C. Power Outage highlights Pepco substation equipment failure, widespread service disruptions, grid reliability concerns,…
View more
GM Software Update Lets EV Owners Sell Power Back to U.S. Grid
GM Vehicle-to-Grid launches via a June 9 software update, allowing some U.S. EV owners to…
View more
Russia to Ban Bitcoin Mining Amid Electricity Deficit
Russia Bitcoin Mining Ban highlights electricity deficits, grid stability concerns, and sustainability challenges, prompting stricter…
View more

PG&E Supports Local Communities as It Pays More Than $230 Million in Property Taxes to 50 California Counties
PG&E property tax payments bolster counties, education, public safety, and infrastructure across Northern and Central…
View more

US Government Condemns Russia for Power Grid Hacking
Russian Cyberattacks on U.S. Critical Infrastructure target energy grids, nuclear plants, water systems, and aviation,…
View more
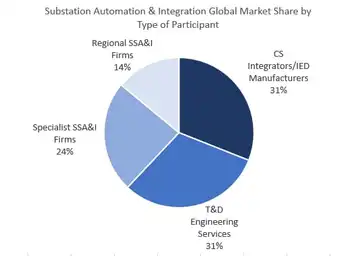
Four Major Types of Substation Integration Service Providers Account for More than $1 Billion in Annual Revenues
Substation Automation Services help electric utilities modernize through integration, EPC engineering, protective relaying, communications and…
View more
Sign Up for Electricity Forum’s Newsletter
Stay informed with our FREE Newsletter — get the latest news, breakthrough technologies, and expert insights, delivered straight to your inbox.
Electricity Today T&D Magazine Subscribe for FREE

Stay informed with the latest T&D policies and technologies.
- Timely insights from industry experts
- Practical solutions T&D engineers
- Free access to every issue

