EU Smart Meters Spur Growth in the Customer Analytics Market


eu smart grid

CSA Z463 Electrical Maintenance

Our customized live online or in‑person group training can be delivered to your staff at your location.

  • Live Online
  • 6 hours Instructor-led
  • Group Training Available
Regular Price:
$249
Coupon Price:
$199
Reserve Your Seat Today

EU Smart Meter Analytics integrates AMI data with grid edge platforms, enabling back-office efficiency, revenue assurance, and customer insights via cloud and PaaS solutions, while system integration cuts costs and improves utility performance.


Key Points

EU smart meter analytics uses AMI data and cloud to improve utility performance, revenue assurance, and outcomes.

✅ AMI underpins grid edge analytics and utility IT/OT integration

✅ Cloud and PaaS reduce costs and scale data-driven applications

✅ Focus shifts from meter rollout to back-office and revenue analytics


Europe's investment in smart meters has begun to open up the market for analytics that benefit both utilities and customers.

Two new reports from GTM Research demonstrate the substantial investment in both advanced metering infrastructure (AMI) and specific customer analytics segments -- the first report analyzes the progress of AMI deployment in Europe, while the second is a comprehensive assessment of analytics use cases, including AI in utility operations, enabled by or interacting with AMI.

The Third Energy Package mandated EU member states to perform a cost-benefit analysis to evaluate the economic viability of deploying smart meters and broader grid modernization costs across member states. Two-thirds of the member states found there was a net positive result, while seven members found negative or inconclusive results.

“The mandate spurred AMI deployment in the EU, but all member states are deploying some AMI. Even without an overall positive cost-benefit outcome, utilities found pockets of customers where there is a positive business case for AMI,” said Paulina Tarrant, research associate at GTM Research and lead author of “Racing to 2020: European Policy, Deployment and Market Share Primer.”

Annual AMI contracting peaked in 2013 -- two years after the mandate -- with 29 million contracted that year. Today, 100 million meters have been contracted overall. As member states reach their respective targets, the AMI market will cool in Europe and spending on analytics and applications will continue to ramp up, aligning with efforts to invest in smarter infrastructure across the sector, Tarrant noted.

Between 2017 and 2021, more than $30 billion will be spent on utility back-office and revenue-assurance analytics in the EU, reflecting the shift toward the digital grid architecture, according to GTM Research’s Grid Edge Customer Utility Analytics Ecosystems: Competitive Analysis, Forecasts and Case Studies.

The report examines the broad landscape of customer analytics showing how AMI interacts with the larger IT/OT environment of a utility.

“The benefits of AMI expand beyond revenue assurance -- in fact, AMI represents the backbone of many customer utility analytics and grid edge solutions,” said Timotej Gavrilovic, author of the Grid Edge Customer Utility Ecosystems report.

Integration is key, according to the report.

“Technology providers are integrating data sets, solutions and systems and partnering with others to provide a one-stop shop serving broad utility needs, increasing efficiencies and reducing costs,” Gavrilovic said. “Cloud-based deployments and platform-as-a-service offerings are becoming commonplace, creating an opportunity for utilities to balance the cost versus performance tradeoff to optimize their analytics systems and applications.”

A diverse array of customer analytics applications is a critical foundation for demonstrating the positive cost-benefit of AMI.

“Advanced analytics and applications are key to ensuring that AMI investments provide a positive return after smart meters are initiated,” said Tarrant. “Improved billing and revenue assurance was not enough everywhere to show customer benefit -- these analytics packages will leverage the distributed network infrastructure, including advanced inverters used with distributed energy resources, and subsequent increased data access, uniting the electricity markets of the EU.”

Related News

US Government Condemns Russia for Power Grid Hacking

Russian Cyberattacks on U.S. Critical Infrastructure target energy grids, nuclear plants, water systems, and aviation, DHS and FBI warn, using spear phishing, malware, and ICS/SCADA intrusion to gain footholds for potential sabotage and disruption.


Key Points

State-backed hacks targeting U.S. energy, nuclear, water and aviation via phishing and ICS access for sabotage.

✅ DHS and FBI detail multi-stage intrusion since 2016

✅ Targets include energy, nuclear, water, aviation, manufacturing

✅ TTPs: spear phishing, lateral movement, ICS reconnaissance


Russia is attacking the U.S. energy grid, with reported power plant breaches unfolding alongside attacks on nuclear facilities, water processing plants, aviation systems, and other critical infrastructure that millions of Americans rely on, according to a new joint analysis by the FBI and the Department of Homeland Security.

In an unprecedented alert, the US Department of Homeland Security (DHS) and FBI have warned of persistent attacks by Russian government hackers on critical US government sectors, including energy, nuclear, commercial facilities, water, aviation and manufacturing.

The alert details numerous attempts extending back to March 2016 when Russian cyber operatives targeted US government and infrastructure.

The DHS and FBI said: “DHS and FBI characterise this activity as a multi-stage intrusion campaign by Russian government cyber-actors who targeted small commercial facilities’ networks, where they staged malware, conducted spear phishing and gained remote access into energy sector networks.

“After obtaining access, the Russian government cyber-actors conducted network reconnaissance, moved laterally and collected information pertaining to industrial control systems.”

The Trump administration has accused Russia of engineering a series of cyberattacks that targeted American and European nuclear power plants and water and electric systems, and could have sabotaged or shut power plants off at will.

#google#

United States officials and private security firms saw the attacks as a signal by Moscow that it could disrupt the West’s critical facilities in the event of a conflict.

They said the strikes accelerated in late 2015, at the same time the Russian interference in the American election was underway. The attackers had compromised some operators in North America and Europe by spring 2017, after President Trump was inaugurated.

In the following months, according to the DHS/FBI report, Russian hackers made their way to machines with access to utility control rooms and critical control systems at power plants that were not identified. The hackers never went so far as to sabotage or shut down the computer systems that guide the operations of the plants.

Still, new computer screenshots released by the Department of Homeland Security have made clear that Russian state hackers had the foothold they would have needed to manipulate or shut down power plants.

“We now have evidence they’re sitting on the machines, connected to industrial control infrastructure, that allow them to effectively turn the power off or effect sabotage,” said Eric Chien, a security technology director at Symantec, a digital security firm.

“From what we can see, they were there. They have the ability to shut the power off. All that’s missing is some political motivation,” Mr. Chien said.

American intelligence agencies were aware of the attacks for the past year and a half, and the Department of Homeland Security and the F.B.I. first issued urgent warnings to utility companies in June, 2017. Both DHS/FBI have now offered new details as the Trump administration imposed sanctions against Russian individuals and organizations it accused of election meddling and “malicious cyberattacks.”

It was the first time the administration officially named Russia as the perpetrator of the assaults. And it marked the third time in recent months that the White House, departing from its usual reluctance to publicly reveal intelligence, blamed foreign government forces for attacks on infrastructure in the United States.

In December, the White House said North Korea had carried out the so-called WannaCry attack that in May paralyzed the British health system and placed ransomware in computers in schools, businesses and homes across the world. Last month, it accused Russia of being behind the NotPetya attack against Ukraine last June, the largest in a series of cyberattacks on Ukraine to date, paralyzing the country’s government agencies and financial systems.

But the penalties have been light. So far, President Trump has said little to nothing about the Russian role in those attacks.

The groups that conducted the energy attacks, which are linked to Russian intelligence agencies, appear to be different from the two hacking groups that were involved in the election interference.

That would suggest that at least three separate Russian cyberoperations were underway simultaneously. One focused on stealing documents from the Democratic National Committee and other political groups. Another, by a St. Petersburg “troll farm” known as the Internet Research Agency, used social media to sow discord and division. A third effort sought to burrow into the infrastructure of American and European nations.

For years, American intelligence officials tracked a number of Russian state-sponsored hacking units as they successfully penetrated the computer networks of critical infrastructure operators across North America and Europe, including in Ukraine.

Some of the units worked inside Russia’s Federal Security Service, the K.G.B. successor known by its Russian acronym, F.S.B.; others were embedded in the Russian military intelligence agency, known as the G.R.U. Still others were made up of Russian contractors working at the behest of Moscow.

Russian cyberattacks surged last year, starting three months after Mr. Trump took office.

American officials and private cybersecurity experts uncovered a series of Russian attacks aimed at the energy, water and aviation sectors and critical manufacturing, including nuclear plants, in the United States and Europe. In its urgent report in June, the Department of Homeland Security and the F.B.I. notified operators about the attacks but stopped short of identifying Russia as the culprit.

By then, Russian spies had compromised the business networks of several American energy, water and nuclear plants, mapping out their corporate structures and computer networks.

They included that of the Wolf Creek Nuclear Operating Corporation, which runs a nuclear plant near Burlington, Kan. But in that case, and those of other nuclear operators, Russian hackers had not leapt from the company’s business networks into the nuclear plant controls.

Forensic analysis suggested that Russian spies were looking for inroads — although it was not clear whether the goal was to conduct espionage or sabotage, or to trigger an explosion of some kind.

In a report made public in October, Symantec noted that a Russian hacking unit “appears to be interested in both learning how energy facilities operate and also gaining access to operational systems themselves, to the extent that the group now potentially has the ability to sabotage or gain control of these systems should it decide to do so.”

The United States sometimes does the same thing. It bored deeply into Iran’s infrastructure before the 2015 nuclear accord, placing digital “implants” in systems that would enable it to bring down power grids, command-and-control systems and other infrastructure in case a conflict broke out. The operation was code-named “Nitro Zeus,” and its revelation made clear that getting into the critical infrastructure of adversaries is now a standard element of preparing for possible conflict.


Reconstructed screenshot fragments of a Human Machine Interface that the threat actors accessed, according to DHS


Sanctions Announced

The US treasury department has imposed sanctions on 19 Russian people and five groups, including Moscow’s intelligence services, for meddling in the US 2016 presidential election and other malicious cyberattacks.

Russia, for its part, has vowed to retaliate against the new sanctions.

The new sanctions focus on five Russian groups, including the Russian Federal Security Service, the country’s military intelligence apparatus, and the digital propaganda outfit called the Internet Research Agency, as well as 19 people, some of them named in the indictment related to election meddling released by special counsel Robert Mueller last month.

In announcing the sanctions, which will generally ban U.S. people and financial institutions from doing business with those people and groups, the Treasury Department pointed to alleged Russian election meddling, involvement in the infrastructure hacks, and the NotPetya malware, which the Treasury Department called “the most destructive and costly cyberattack in history.”

The new sanctions come amid ongoing criticism of the Trump administration’s reluctance to punish Russia for cyber and election meddling. Sen. Mark Warner (D-Va.) said that, ahead of the 2018 mid-term elections, the administration’s decision was long overdue but not enough. “Nearly all of the entities and individuals who were sanctioned today were either previously under sanction during the Obama Administration, or had already been charged with federal crimes by the Special Counsel,” Warner said.


Warning: The Russians Are Coming

In an updated warning to utility companies, DHS/FBI officials included a screenshot taken by Russian operatives that proved they could now gain access to their victims’ critical controls, prompting a renewed focus on protecting the U.S. power grid among operators.

American officials and security firms, including Symantec and CrowdStrike, believe that Russian attacks on the Ukrainian power grid in 2015 and 2016 that left more than 200,000 citizens there in the dark are an ominous sign of what the Russian cyberstrikes may portend in the United States and Europe in the event of escalating hostilities.

Private security firms have tracked the Russian government assaults on Western power and energy operators — conducted alternately by groups under the names Dragonfly campaigns alongside Energetic Bear and Berserk Bear — since 2011, when they first started targeting defense and aviation companies in the United States and Canada.

By 2013, researchers had tied the Russian hackers to hundreds of attacks on the U.S. power grid and oil and gas pipeline operators in the United States and Europe. Initially, the strikes appeared to be motivated by industrial espionage — a natural conclusion at the time, researchers said, given the importance of Russia’s oil and gas industry.

But by December 2015, the Russian hacks had taken an aggressive turn. The attacks were no longer aimed at intelligence gathering, but at potentially sabotaging or shutting down plant operations.

At Symantec, researchers discovered that Russian hackers had begun taking screenshots of the machinery used in energy and nuclear plants, and stealing detailed descriptions of how they operated — suggesting they were conducting reconnaissance for a future attack.

Eventhough the US government enacted sanctions, cybersecurity experts are still questioning where the Russian attacks could lead, given that the United States was sure to respond in kind.

“Russia certainly has the technical capability to do damage, as it demonstrated in the Ukraine,” said Eric Cornelius, a cybersecurity expert at Cylance, a private security firm, who previously assessed critical infrastructure threats for the Department of Homeland Security during the Obama administration.

“It is unclear what their perceived benefit would be from causing damage on U.S. soil, especially given the retaliation it would provoke,” Mr. Cornelius said.

Though a major step toward deterrence, publicly naming countries accused of cyberattacks still is unlikely to shame them into stopping. The United States is struggling to come up with proportionate responses to the wide variety of cyberespionage, vandalism and outright attacks.

Lt. Gen. Paul Nakasone, who has been nominated as director of the National Security Agency and commander of United States Cyber Command, the military’s cyberunit, said during his recent Senate confirmation hearing, that countries attacking the United States so far have little to worry about.

“I would say right now they do not think much will happen to them,” General Nakasone said. He later added, “They don’t fear us.”


Related News

View more

Americans Keep Using Less and Less Electricity

U.S. Electricity Demand Decoupling signals GDP growth without higher load, driven by energy efficiency, LED adoption, services-led output, and rising renewables integration with the grid, plus EV charging and battery storage supporting decarbonization.


Key Points

GDP grows as electricity use stays flat, driven by efficiency, renewables, and a shift toward services and output.

✅ LEDs and codes cut residential and commercial load intensity.

✅ Wind, solar, and gas gain share as coal and nuclear struggle.

✅ EVs and storage can grow load and enable grid decarbonization.


By Justin Fox

Economic growth picked up a little in the U.S. in 2017. But electricity use fell, with electricity sales projections continuing to decline, according to data released recently by the Energy Information Administration. It's now been basically flat for more than a decade:


Measured on a per-capita basis, electricity use is in clear decline, and is already back to the levels of the mid-1990s.


Sources: U.S. Energy Information Administration, U.S. Bureau of Economic Analysis

*Includes small-scale solar generation from 2014 onward


I constructed these charts to go all the way back to 1949 in part because I can (that's how far back the EIA data series goes) but also because it makes clear what a momentous change this is. Electricity use rose and rose and rose and then ... it didn't anymore.

Slower economic growth since 2007 has been part of the reason, but the 2017 numbers make clear that higher gross domestic product no longer necessarily requires more electricity, although the Iron Law of Climate is often cited to suggest rising energy use with economic growth. I wrote a column last year about this big shift, and there's not a whole lot new to say about what's causing it: mainly increased energy efficiency (driven to a remarkable extent by the rise of LED light bulbs), and the continuing migration of economic activity away from making tangible things and toward providing services and virtual products such as games and binge-watchable TV series (that are themselves consumed on ever-more-energy-efficient electronic devices).

What's worth going over, though, is what this means for those in the business of generating electricity. The Donald Trump administration has made saving coal-fired electric plants a big priority; the struggles of nuclear power plants have sparked concern from multiple quarters. Meanwhile, U.S. natural gas production has grown by more than 40 percent since 2007, thanks to hydraulic fracturing and other new drilling techniques, while wind and solar generation keep making big gains in cost and market share. And this is all happening within the context of a no-growth electricity market.

In China, a mystery in China's electricity data has complicated global comparisons.


Here are the five main sources of electric power in the U.S.:


The big story over the past decade has been coal and natural gas trading places as the top fuel for electricity generation. Over the past year and a half coal regained some of that lost ground as natural gas prices rose from the lows of early 2016. But with overall electricity use flat and production from wind and solar on the rise, that hasn't translated into big increases in coal generation overall.

Oh, and about solar. It's only a major factor in a few states (California especially), so it doesn't make the top five. But it's definitely on the rise.


What happens next? For power generators, the best bet for breaking out of the current no-growth pattern is to electrify more of the U.S. economy, especially transportation. A big part of the attraction of electric cars and trucks for policy-makers and others is their potential to be emissions-free. But they're only really emissions-free if the electricity used to charge them is generated in an emissions-free manner -- creating a pretty strong business case for continuing "decarbonization" of the electric industry. It's conceivable that electric car batteries could even assist in that decarbonization by storing the intermittent power generated by wind and solar and delivering it back onto the grid when needed.

I don't know exactly how all this will play out. Nobody does. But the business of generating electricity isn't going back to its pre-2008 normal. 


Related News

View more

Why Is Georgia Importing So Much Electricity?

Georgia Electricity Imports October 2017 surged as hydropower output fell and thermal power plants underperformed; ESCO balanced demand via low-cost imports, mainly from Azerbaijan, amid rising tariffs, kWh consumption growth, and a widening generation-consumption gap.


Key Points

They mark a record import surge due to costly local generation, lower hydropower, ESCO balancing costs, and rising demand.

✅ Imports rose 832% YoY to 157 mln kWh, mainly from Azerbaijan

✅ TPP output fell despite capacity; only low-tariff plants ran

✅ Balancing price 13.8 tetri/kWh signaled costly domestic PPAs


In October 2017, Georgian power plants generated 828 mln. KWh of electricity, marginally up (+0.79%) compared to September. Following the traditional seasonal pattern and amid European concerns over dispatchable power shortages affecting markets, the share of electricity produced by renewable sources declined to 71% of total generation (87% in September), while thermal power generation’s share increased, accounting for 29% of total generation (compared to 13% in September). When we compare last October’s total generation with the total generation of October 2016, however, we observe an 8.7% decrease in total generation (in October 2016, total generation was 907 mln. kWh). The overall decline in generation with respect to the previous year is due to a simultaneous decline in both thermal power and hydro power generation. 

Consumption of electricity on the local market in the same period was 949 mln. kWh (+7% compared to October 2016, and +3% with respect to September 2017), and reflected global trends such as India's electricity growth in recent years. The gap between consumption and generation increased to 121 mln. kWh (15% of the amount generated in October), up from 100 mln. kWh in September. Even more importantly, the situation was radically different with respect to the prior year, when generation exceeded consumption.

The import figure for October was by far the highest from the last 12 years (since ESCO was established), occurring as Ukraine electricity exports resumed regionally, highlighting wider cross-border dynamics. In October 2017, Georgia imported 157 mln. kWh of electricity (for 5.2 ¢/kWh – 13 tetri/kWh). This constituted an 832% increase compared to October 2016, and is about 50% larger than the second largest import figure (104.2 mln. kWh in October 2014). Most of the October 2017 imports (99.6%) came from Azerbaijan, with the remaining 0.04% coming from Russia.

The main question that comes to mind when observing these statistics is: why did Georgia import so much? One might argue that this is just the result of a bad year for hydropower generation and increased demand. This argument, however, is not fully convincing. While it is true that hydropower generation declined and demand increased, the country’s excess demand could have been easily satisfied by its existing thermal power plants, even as imported coal volumes rose in regional markets. Instead of increasing, however, the electricity coming from thermal power plants declined as well. Therefore, that cannot be the reason, and another must be found. The first that comes to mind is that importing electricity may have been cheaper than buying it from local TPPs, or from other generators selling electricity to ESCO under power purchase agreements (PPAs). We can test the first part of this hypothesis by comparing the average price of imported electricity to the price ceiling on the tariff that TPPs can charge for the electricity they sell. Looking at the trade statistics from Geostat, the average price for imported electricity in October 2017 remained stable with respect to the same month of the previous year, at 5.2 ¢ (13 tetri) per kWh. Only two thermal power plants (Gardabani and Mtkvari) had a price ceiling below 13 tetri per kWh. Observing the electricity balance of Georgia, we see that indeed more than 98% of the electricity generated by TPPs in October 2017 was generated by those two power plants.

What about other potential sources of electricity amid Central Asia's power shortages at the time? To answer this question, we can use the information derived from the weighted average price of balancing electricity. Why balancing electricity? Because it allows us to reconstruct the costs the market operator (ESCO) faced during the month of October to make sure demand and supply were balanced, and it allows us to gain an insight about the price of electricity sold through PPAs.

ESCO reports that the weighted average price of balancing electricity in October 2017 was 13.8 tetri/kWh, (25% higher than in October 2016, when it was below the average weighted cost of imports – 11 vs. 13 – and when the quantity of imported electricity was substantially smaller). Knowing that in October 2017, 61% of balancing electricity came from imports, while 39% came from hydropower and wind power plants selling electricity to ESCO under their PPAs, we can deduce that in this case, internal generation was (on average) also substantially more expensive than imports. Therefore, the high cost of internally generated electricity, rather than the technical impossibility of generating enough electricity to satisfy electricity demand, indeed appears to be one the main reasons why electricity imports spiked in October 2017.


Related News

View more

Four Major Types of Substation Integration Service Providers Account for More than $1 Billion in Annual Revenues

Substation Automation Services help electric utilities modernize through integration, EPC engineering, protective relaying, communications and security, with CAPEX and OPEX insights and a growing global market for third-party providers worldwide rapidly.


Key Points

Engineering, integration, and EPC support modernizing utility substations with protection, control, and secure communications

✅ Third-party engineering, EPC, and OEM services for utilities

✅ Integration of multi-vendor devices and platforms

✅ Focus on relays, communications, security, CAPEX-OPEX


The Newton-Evans Research Company has released additional findings from its newly published four volume research series entitled: The World Market for Substation Automation and Integration Programs in Electric Utilities: 2017-2020.

This report series has observed four major types of professional third-party service providers that assist electric utilities with substation modernization. These firms range from (1) smaller local or regional engineering consultancies with substation engineering resources to (2) major global participants in EPC work, to (3) the engineering services units of manufacturers of substation devices and platforms, to (4) substation integration specialist firms that source and integrate devices from multiple manufacturers for utility and industrial clients, and often provide substation automation training to support implementation.

2016 Global Share Estimates for Professional Services Providers of Electric Power Substation Integration and Automation Activities

The North American market report (Volume One) includes survey participation from 65 large and midsize US and Canadian electric utilities while the international market report (Volume Two) includes survey participation from 32 unique utilities in 20 countries around the world. In addition to the baseline survey questions, the report includes 2017 substation survey findings on four additional specific topics: communications issues; protective relaying trends; security topics and the CAPEX/OPEX outlook for substation modernization.

Volume Three is the detailed market synopsis and global outlook for substation automation and integration:

Section One of the report provides top-level views of substation modernization, automation & integration and the emerging digital grid landscape, and a narrative market synopsis.

Section Two provides mid-year 2017 estimates of population, electric power generation capacity, transmission substations, including the 2 GW UK substation commissioning as a benchmark, and primary MV distribution substations for more than 120 countries in eight world regions. Information on substation related expenditures and spending for protection and control for each major world region and several major countries is also provided.

Section Three provides information on NGO funding resources for substation modernization among developing nations.

Section Four of this report volume includes North American market share estimates for 2016 shipments of many substation automation-related devices and equipment, such as trends in the digital relay market for utilities.

The Supplier Profiles report (Volume Four) provides descriptive information on the substation modernization offerings of more than 90 product and services companies, covering leading players in the transformer market as well.


Related News

View more

Energy Efficiency and Demand Response Can Nearly Level Southeast Electricity Demand for More than a Decade

Southeast Electricity Demand Forecast examines how energy efficiency, photovoltaics, electric vehicles, heat pumps, and demand response shape grid needs, stabilize load through 2030, shift peaks, and inform utility planning across the region.


Key Points

An outlook of load shaped by efficiency, solar, EVs, with demand response keeping usage steady through 2030.

✅ Stabilizes regional demand through 2030 under accelerated adoption

✅ Energy efficiency and demand response are primary levers

✅ EVs and heat pumps drive growth post 2030; shift winter peaks


Electricity markets in the Southeast are facing many changes on the customer side of the meter. In a new report released today, we look at how energy efficiency, photovoltaics (solar electricity), electric vehicles, heat pumps, and demand response (shifting loads from periods of high demand) might affect electricity needs in the Southeast.

We find that if all of these resources are pursued on an accelerated basis, electricity demand in the region can be stabilized until about 2030.

After that, demand will likely grow in the following decade because of increased market penetration of electric vehicles and heat pumps, but energy planners will have time to deal with this growth if these projections are borne out. We also find that energy efficiency and demand response can be vital for managing electricity supply and demand in the region and that these resources can help contain energy demand growth, reducing the impact of expensive new generation on consumer wallets.


National trends

This is the second ACEEE report looking at regional electricity demand. In 2016, we published a study on electricity consumption in New England, finding an even more pronounced effect. For New England, with even more aggressive pursuit of energy efficiency and these other resources, consumption was projected to decline through about 2030, before rebounding in the following decade.

These regional trends fit into a broader national pattern. In the United States, electricity consumption has been characterized by flat electricity demand for the past decade. Increased energy efficiency efforts have contributed to this lack of consumption growth, even as the US economy has grown since the Great Recession. Recently, the US Energy Information Administration (EIA – a branch of the US Department of Energy) released data on US electricity consumption in 2016, finding that 2016 consumption was 0.3% below 2015 consumption, and other analysts reported a 1% slide in 2023 on milder weather.


Five scenarios for the Southeast

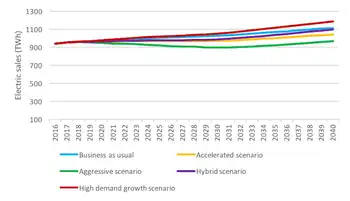
ACEEE’s new study focuses on the Southeast because it is very different from New England, with warmer weather, more economic growth, and less-aggressive energy efficiency and distributed energy policies than the Northeast. For the Southeast, we examined five scenarios: a business-as-usual scenario; two alternative scenarios with progressively higher levels of energy efficiency, photovoltaics informed by a solar strategy for the South that is emerging regionally, electric vehicles, heat pumps, and demand response; and two scenarios combining high numbers of electric vehicles and heat pumps with more modest levels of the other resources. This figure presents electricity demand for each of these scenarios:

Over the 2016-2040 period, we project that average annual growth will range from 0.1% to 1.0%, depending on the scenario, much slower than historic growth in the region. Energy efficiency is generally the biggest contributor to changes in projected 2040 electricity consumption relative to the business-as-usual scenario, as shown in the figure below, which presents our accelerated scenario that is based on levels of energy efficiency and other resources now targeted by leading states and utilities in the Southeast.

To date, Entergy Arkansas has achieved the annual efficiency savings as a percent of sales shown in the accelerated scenario and Progress Energy (a division of Duke Energy) has nearly achieved those savings in both North and South Carolina. Sixteen states outside the Southeast have also achieved these savings statewide.

The efficiency savings shown in the aggressive scenario have been proposed by the Arkansas PSC. This level of savings has already been achieved by Arizona as well as six other states. Likewise, the demand response savings we model have been achieved by more than 10 utilities, including four in the Southeast. The levels of photovoltaic, electric vehicle, and heat pump penetration are more speculative and are subject to significant uncertainty.

We also examined trends in summer and winter peak demand. Most utilities in the Southeast have historically had peak demand in the summer, often seeing heatwave-driven surges that stress operations across the Eastern U.S., but our analysis shows that winter peaks will be more likely in the region as photovoltaics and demand response reduce summer peaks and heat pumps increase winter peaks.


Why it’s vital to plan broadly

Our analysis illustrates the importance of incorporating energy efficiency, demand response, and photovoltaics into utility planning forecasts as utility trends to watch continue to evolve. Failing to include these resources leads to much higher forecasts, resulting in excess utility system investments, unnecessarily increasing customer electricity rates. Our analysis also illustrates the importance of including electric vehicles and heat pumps in long-term forecasts. While these technologies will have moderate impacts over the next 10 years, they could become increasingly important in the long run.

We are entering a dynamic period of substantial uncertainty for long-term electricity sales and system peaks, highlighted by COVID-19 demand shifts that upended typical patterns. We need to carefully observe and analyze developments in energy efficiency, photovoltaics, electric vehicles, heat pumps, and demand response over the next few years. As these technologies advance, we can create policies to reduce energy bills, system costs, and harmful emissions, drawing on grid reliability strategies tested in Texas, while growing the Southeast’s economy. Resource planners should be sure to incorporate these emerging trends and policies into their long-term forecasts and planning.


Related News

View more

California just made more clean energy than it needed

CAISO Net Negative Emissions signal moments when greenhouse gas intensity of serving ISO demand drops below zero, driven by high renewable generation, low load, strong solar exports, and imports accounting in the California grid.


Key Points

Moments when CAISO's CO2 to serve demand is below zero, driven by renewables, exports, and import accounting.

✅ Calculated using imports and exports to serve ISO demand

✅ Occur during high solar output, low weekend load

✅ Coincide with curtailment and record renewable penetration


We’re a long way from the land of milk and honey, but on Easter Sunday – for about an hour – we got a taste.

On Sunday, at 1:55 PM Pacific Time the California Independent Systems Operator (CAISO) reported that greenhouse gas emissions necessary to serve its demand (~80% of California’s electricity demand on an annual basis), was measured at a rate -16 metric tons of CO2 per hour. Five minutes later, the value was -2 mTCO2/h, before it crept back up to 40 mTCO2/h at 2:05 PM PST. At 2:10 PST though it fell back to -86 mTCO2/h and stayed negative until 3:05 PM PST, even as global CO2 emissions flatlined in 2019 according to the IEA.

This information was brought to the attention of pv magazine via tweet from eagle eye Jon Pa after CAISO’s site first noted the negative values:

The region was still generating CO2 though, as natural gas, biogas, biomass, geothermal and even coal plants were running and pumping out emissions, even as potent greenhouse gases declined in the US under control efforts. CAISO’s Greenhouse Gas Emission Tracking Methodology, December 28, 2016 (pdf) notes the below calculations to create the value what it terms, “Total GHG emissions to serve ISO demand”:

Of importance to note is that to get to the net negative value, CAISO considered all electricity imports and exports, a reminder that climate policy shapes grid operations across North America. And as can be noted in the image below the CO2 intensity of imports during the day rapidly declined as the sun came up, first going negative around 9:05 AM PST, and mostly staying so until just before 6 PM PST.

During this same weekend, other records were noted (reiterating that we’re in record setting season and as the state pursues its 100% carbon-free mandate now in law) such as a new electricity export record of greater than 2 GW and total renewable electricity as part of total demand at greater than 70%.

At the peak negative moment of 2:15 PM PST, -112 mTCO2/h seen below, the total amount of clean instantaneous generation being used in the power grid region was 17 GW, a far cry from heat-driven reliability strains like rolling blackout warnings that arise during extreme demand, with renewables giving 76% of the total, hydro 14%, nuclear 13% and imports of -12% countering the CO2 coming from just over 1.4 GW of gas generation.

Also of importance are a few layers of nuance in the electricity demand charts. First off we’re in the shoulder seasons  of California – nice cool weather before the warmth of summer drives air conditioning demand. Additional the weekend electricity demand is always lower, as well, Easter Sunday might have had an affect, whereas in colder regions Calgary’s electricity use can soar during frigid snaps.

Lastly to note was the amount of electricity from solar and wind generation being curtailed. And while the Sunday numbers weren’t available yet, the below image noted Saturday with 10 GWh in total being curtailed (pdf) – peaking at over 3.2 GW of instantaneous mostly solar power even as solar is now the cheapest electricity according to the IEA, in the hours of 2 and 3 PM PST. On an annualized basis, less than 2% of total potential solar electricity was curtailed in 2018.


Related News

View more

Sign Up for Electricity Forum’s Newsletter

Stay informed with our FREE Newsletter — get the latest news, breakthrough technologies, and expert insights, delivered straight to your inbox.

Electricity Today T&D Magazine Subscribe for FREE

Stay informed with the latest T&D policies and technologies.
  • Timely insights from industry experts
  • Practical solutions T&D engineers
  • Free access to every issue

Download the 2025 Electrical Training Catalog

Explore 50+ live, expert-led electrical training courses –

  • Interactive
  • Flexible
  • CEU-cerified