Nevada to Power Clean Vehicles with Clean Electricity


electric evs

CSA Z462 Arc Flash Training - Electrical Safety Essentials

Our customized live online or in‑person group training can be delivered to your staff at your location.

  • Live Online
  • 6 hours Instructor-led
  • Group Training Available
Regular Price:
$249
Coupon Price:
$199
Reserve Your Seat Today

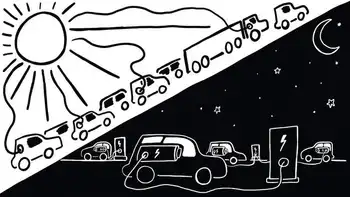
Nevada EV Charging Plan will invest $100 million in highway, urban, and public charging, bus depots, and Lake Tahoe sites, advancing NV Energy's SB 448 goals for clean energy, air quality, equity, and tourism recovery.


Key Points

Program invests $100M in EV infrastructure under SB 448, led by NV Energy, expanding clean charging across Nevada.

✅ $100M for statewide charging over 3 years

✅ 50% invested in overburdened communities

✅ Supports SB 448, climate and air quality goals


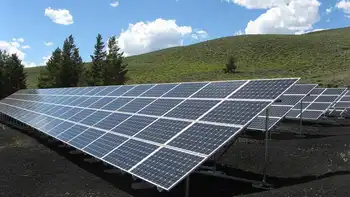
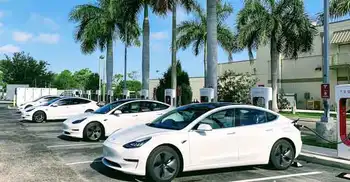
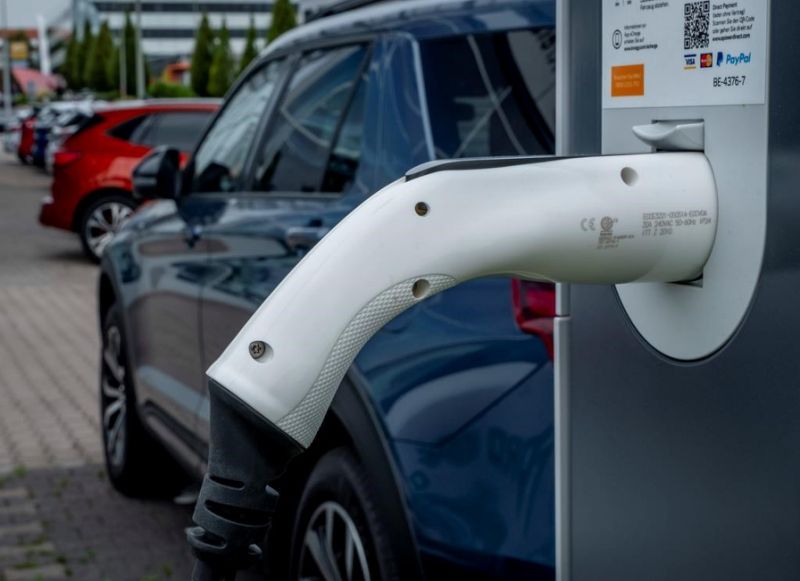
The Public Utilities Commission of Nevada approved a $100 million program that will deploy charging stations for electric vehicles (EVs) along highways, in urban areas, at public buildings, in school and transit bus depots, and at Red Rocks and Lake Tahoe, as charging networks compete to expand access. Combined with the state's clean vehicle standards and its aggressive renewable energy requirements, this means cars, trucks, buses, and boats in Nevada will be powered by increasingly clean electricity, reflecting how electricity is changing across the country.

The “Economic Recovery Transportation Electrification Plan” proposed by NV Energy, aligning with utilities' bullish plans for EV charging, was required by Senate Bill (SB) 448 (Brooks). Nevada’s tourism-centric economy was hit hard by the pandemic, and, as an American EV boom accelerates nationwide, the $100 million investment in charging infrastructure for light, medium, and heavy-duty EVs over the next three years was designed to provide much needed economic stimulus without straining the state’s budget.

Half of those investments will be made in communities that have borne a disproportionate share of transportation pollution and have suffered most from COVID-19—a disease that is made more deadly by exposure to local air pollution—and, amid evolving state grid challenges that planners are addressing, ensuring equitable deployment will help protect reliability and health.

SB 448 also requires NV Energy to propose subsequent “Transportation Electrification Plans” to keep the state on track to meet its climate, air quality, and equity goals, recognizing that a much bigger grid may be needed as adoption grows. A  report from MJ Bradley & Associates commissioned by NRDC, Southwest Energy Efficiency Project, and Western Resource Advocates demonstrates Nevada could realize $21 billion in avoided expenditures on gasoline and maintenance, reduced utility bills, and environmental benefits, with parallels to New Mexico's projected benefits highlighted in recent analyses, by 2050 if more drivers make the switch to EVs.


Related News

Related News

Canada’s Clean Energy Sector Growth

Canada’s clean energy sector is expanding as Indigenous communities lead electricity transmission projects, drive sustainable growth, and strengthen energy independence through renewable power, community ownership, and grid connections across remote and regional areas of Canada.


What is Canada’s Clean Energy Sector?

Canada’s clean energy sector encompasses industries and initiatives that generate, transmit, and manage low-carbon electricity to meet the country's national climate goals. It emphasizes Indigenous participation, renewable innovation, and equitable economic growth.

✅ Expands renewable electricity generation and transmission

✅ Builds Indigenous-led ownership and partnerships

✅ Reduces emissions through sustainable energy transition


Canada’s clean energy sector is entering a pivotal era of transformation, with Indigenous communities emerging as leading partners in expanding electricity transmission and renewable infrastructure, including grid modernization projects that are underway nationwide. These communities are not only driving projects that connect remote regions to the grid but also redefining what energy leadership and equity look like in Canada.

At a recent webinar co-hosted by the Canadian Climate Institute and the Indigenous Power Coalition, panellists discussed the growing wave of Indigenous-led electricity transmission projects and the policies needed to strengthen Indigenous participation. The event, moderated by Frank Busch, featured Margaret Kenequanash, CEO of Wataynikaneyap Power; Kahsennenhawe Sky-Deer, Grand Chief of the Mohawk Council of Kahnawà:ke; and Blaise Fontaine, Co-Founder of ProACTIVE Planning Inc. and Indigenous Power Coalition.

The discussion comes at a crucial moment for Canada’s clean energy transition. As the country races to meet its climate commitments and zero-emissions electricity by 2035 targets, demand for clean power is rising rapidly. Historically, energy development in Canada occurred on Indigenous lands without consent or fair participation, but today, Indigenous communities collectively represent the largest clean energy asset owners outside Crown and private utilities.

“There is a genuine appetite for Indigenous communities to not just own transmission projects but to also lead,” said Fontaine. He noted that Indigenous communities are increasingly setting the terms of engagement, selecting partners, and shaping projects in line with their cultural and environmental values.

One of the strongest examples of this transformation is the Wataynikaneyap (Watay) Power Project in northern Ontario, a 1,800-kilometre transmission line connecting 17 remote First Nations communities to the provincial grid. “Communities must fully understand what they are getting into, since it is their homelands that will be impacted,” said Kenequanash. She emphasized that the project’s success came from five years of inter-community meetings to agree on shared principles before any external engagement.

The panel also highlighted the Hertel–New York Interconnection Line, co-owned by Hydro-Québec and the Mohawk Council of Kahnawà:ke, as another milestone in Indigenous energy leadership. Sky-Deer noted that the project’s co-ownership model required Quebec’s National Assembly to pass Bill 13, a first-of-its-kind legal framework. “That was a breakthrough,” she said, “but it also shows that true partnership still depends on one-off exceptions rather than standard policy.”

Panellists agreed that Canada’s regulatory systems have not kept pace with Indigenous leadership. Fontaine called on governments to “think outside the box to avoid staying stuck in the status quo,” emphasizing the need for enabling policies that align with an electric, connected and clean vision for Canada while making Indigenous-led ownership the norm rather than the exception.

Financial readiness is another key factor driving Indigenous participation. Communities are now accessing capital through partnerships with financial institutions and government loan programs, and growing evidence that a 2035 zero-emissions grid is practical and profitable is strengthening investor confidence. The collaboration between the Mohawk Council of Kahnawà:ke and the Caisse de dépôt et placement du Québec exemplifies tailored financing and long-term investment that supports community ownership and sustainable growth.

True equity, however, goes beyond financial participation. “It’s not just about having a percentage stake,” Fontaine explained. “True equity means meaningful decision-making power and control.” Indigenous leaders are insisting on co-governance structures that align with their worldviews, prioritizing environmental protection, cultural respect, and intergenerational stewardship.

The benefits of this approach extend far beyond project economics. Communities involved in ownership experience tangible local benefits, including employment and training opportunities, as well as new investments in education and culture. Hydro-Québec’s $10 million contribution to the Kahnawà:ke Cultural Arts Center is one example of how partnerships can support cultural renewal and community development.

As Canada looks to build east–west electricity interties and expand renewable energy generation, including solar where Canada has lagged in deployment nationwide, Indigenous leadership is becoming increasingly central to national energy policy. Fontaine noted that this shift offers “even greater opportunities for Indigenous-led transmission as Canada connects its provinces rather than just exporting power south.”

In particular, Alberta's energy profile highlights both rapid growth in renewables and ongoing fossil fuel strength, informing intertie planning and market design.

On the National Truth and Reconciliation Day, panellists urged reflection on both the barriers that remain and the opportunities ahead. Indigenous leadership in Canada’s clean energy sector is proving that reconciliation can take tangible form, through ownership, partnership, and shared prosperity.

This transformation represents more than an energy transition; it’s a rebalancing of power, respect, and responsibility, carried out “in a good way,” as the panellists emphasized, and essential to building a clean, inclusive energy future for all Canadians while strengthening the global electricity market position of the country.


Related Articles


View more

Wind, solar, batteries make up 82% of 2023 utility-scale US pipeline

US Renewable Energy Capacity 2023 leads new utility-scale additions, with solar, wind, and battery storage surging; EIA data cite tax incentives, lower costs, and smart grid upgrades driving grid reliability and decarbonization.


Key Points

In 2023, renewables dominate new US utility-scale capacity: 54% solar, 7.1 GW wind, 8.6 GW battery storage, per EIA.

✅ 54% of 2023 US additions are solar, a record year

✅ 7.1 GW wind and 8.6 GW batteries expand grid resources

✅ Storage, smart grids, incentives boost reliability and growth


Wind, solar, and batteries make up 82% of 2023’s expected new utility-scale power capacity in the US, highlighting wind power's surge alongside solar and storage, according to the US Energy Information Administration’s (EIA) “Preliminary Monthly Electric Generator Inventory.”

As of January 2023, the US was operating 73.5 gigawatts (GW) of utility-scale solar capacity, which aligns with rising solar generation trends across the US – about 6% of the country’s total.

But solar makes up just over half of new US generating capacity expected to come online in 2023, supported by favourable government plans across key markets. And if it all goes as expected, it will be the most solar capacity added in a single year in the US. It will also be the first year that more than half of US capacity additions are solar, underscoring solar's No. 3 renewable ranking in the U.S. mix.

As of January 2023, 141.3 GW of wind capacity was operating in the US, reflecting wind's status as the most-used renewable nationwide – about 12% of the US total. Another 7.1 GW are planned for 2023. Tax incentives, lower wind turbine construction costs, and new renewable energy targets are spurring the growth. 

And developers also plan to add 8.6 GW of battery storage power capacity to the grid this year, supporting record solar and storage buildouts across the market, and that’s going to double total US battery power capacity.

However, differences in the amount of electricity that different types of power plants can produce mean that wind and solar made up about 17% of the US’s utility-scale capacity in 2021, but produced 12% of electricity, even as renewables surpassed coal nationally in 2022. Solutions such as energy storage, smart grids, and infrastructure development will help bridge that gap.


Related News

View more

Report: Canada's renewable energy growth projections scaled back after Ontario scraps clean energy program

Canada Renewable Energy Outlook highlights IEA forecasts of slower capacity growth as Ontario cancels LRP auctions; wind, solar, and hydro expand amid carbon pricing, coal phase-out, Alberta tenders, and falling costs despite natural gas competition.


Key Points

The Canada Renewable Energy Outlook distills IEA projections and policies behind wind, solar, and hydro growth to 2022.

✅ IEA trims Canada renewables growth to 9 GW by 2022

✅ Ontario LRP cuts and Quebec tenders reduce near-term additions

✅ Wind, solar, hydro expand amid carbon pricing and coal phase-out


A new report expects growth in Canadian renewable energy capacity to slow in the next five years compared to earlier projections, a decrease that comes after Ontario scrapped a contentious clean energy program aimed at boosting wind and solar supplies.

The International Energy Agency’s annual outlook for renewable energy, released Wednesday, projects Canada’s renewable capacity to grow by nine gigawatts between 2017 and 2022, down from last year’s report that projected capacity would grow by 13GW.

The influential Paris-based agency said its recent outlook for Canadian renewables was “less optimistic” than its 2016 projection due to “recent changes in auctions schemes in Ontario and Quebec.”


PROGRAM CUTS

In mid-2016 the Ontario government suspended the second phase of its Large Renewable Procurement (LPR) program, axing $3.8 billion in planned renewable energy contracts. And Quebec cancelled tenders for several clean energy projects, which also led the agency to trim its forecasts, the report said.

Ontario cut the LRP program amid anger over rising electricity bills, which critics said was at least partly due to the rapid expansion of wind power supplies across the province.

Experts said the rise in costs was also partly due to major one-time costs to maintain aging infrastructure, particularly the $12.8-billion refurbishment of the Darlington nuclear plant located east of Toronto. The province also has plans to renovate the nearby Pickering nuclear plant in coming years.

The IEA report comes as Ottawa aims to drastically cut carbon emissions, largely by expanding renewable energy capacity. The provinces, including the Prairie provinces, have meanwhile been looking to pare back emissions by phasing out coal and implementing a carbon tax.

While Ontario’s decision to scrap the LRP program is a minor setback in the near-term, analysts say that tightening environmental policy in Canada and elsewhere will regardless continue to drive rapid growth in renewable energy supplies like wind power and solar.

Even the threat of cheap supplies of natural gas, a major competitor to renewable supplies, is unlikely to keep wind and solar supplies off the market, despite lagging solar demand in some regions, as costs continue to fall.

“It’s not just this (Ontario) renewables program, it’s the carbon pricing program, the coal phase out, a whole plethora of programs that are squeezing natural gas margins,” said Dave Sawyer, an economist at EnviroEconomics in Ottawa.


RENEWABLE ENERGY CAPACITY

Canada’s renewable energy capacity is still expected to grow at a robust 10 per cent per year, the report said, and is expected to supply 69 per cent of overall power generation in the country by 2022.

The IEA, however, expects the growth in hydro power capacity to “slow significantly” beyond 2022, after a raft of new hydro projects come online.

Canadian hydro power capacity is projected to grow 2.2GW in the next five years, mostly due to the commissioning of the Keeyask plant in Manitoba the Muskrat Falls dam in Newfoundland and Labrador and the Romaine 3 and 4 stations in Quebec, in a sector where Canada ranks in the top 10 for hydropower jobs nationwide.

Solar capacity in Canada is expected to grow by 2GW to 4.7GW in 2022, approaching the 5 GW milestone in the near term, mostly due to feed-in-tariff programs in Ontario and renewable energy tenders currently underway in Alberta.

Globally, China and India lead renewable capacity growth projections. China alone is expected to be responsible for 40 per cent of renewable capacity growth in the next five years, while India will double its renewable electricity capacity by 2022. The world is collectively expected to grow renewable electricity capacity by 43 per cent between 2017 and 2022.


Related News

View more

Record numbers of solar panels were shipped in the United States during 2021

U.S. Solar Panel Shipments 2021 surged to 28.8 million kW of PV modules, tracking utility-scale and small-scale capacity additions, driven by imports from Asia, resilient demand, supply chain constraints, and declining prices.


Key Points

Record 28.8M kW PV modules shipped in 2021; 80% imports; growth in utility- and small-scale capacity with lower prices.

✅ 28.8M kW shipped, up from 21.8M kW in 2020 (record capacity)

✅ 80% of PV module shipments were imports, mainly from Asia

✅ Utility-scale +13.2 GW; small-scale +5.4 GW; residential led


U.S. shipments of solar photovoltaic (PV) modules (solar panels) rose to a record electricity-generating capacity of 28.8 million peak kilowatts (kW) in 2021, from 21.8 million peak kW in 2020, based on data from our Annual Photovoltaic Module Shipments Report. Continued demand for U.S. solar capacity drove this increase in solar panel shipments in 2021, as solar's share of U.S. electricity continued to rise.

U.S. solar panel shipments include imports, exports, and domestically produced and shipped panels. In 2021, about 80% of U.S. solar panel module shipments were imports, primarily from Asia, even as a proposed tenfold increase in solar aims to reshape the U.S. electricity system.

U.S. solar panel shipments closely track domestic solar capacity additions; differences between the two usually result from the lag time between shipment and installation, and long-term projections for solar's generation share provide additional context. We categorize solar capacity additions as either utility-scale (facilities with one megawatt of capacity or more) or small-scale (largely residential solar installations).

The United States added 13.2 gigawatts (GW) of utility-scale solar capacity in 2021, an annual record and 25% more than the 10.6 GW added in 2020, according to our Annual Electric Generator Report. Additions of utility-scale solar capacity reached a record high, reflecting strong growth in solar and storage despite project delays, supply chain constraints, and volatile pricing.

Small-scale solar capacity installations in the United States increased by 5.4 GW in 2021, up 23% from 2020 (4.4 GW), as solar PV and wind power continued to grow amid favorable government plans. Most of the small-scale solar capacity added in 2021 was installed on homes. Residential installations totaled more than 3.9 GW in 2021, compared with 2.9 GW in 2020.

The cost of solar panels has declined significantly since 2010. The average value (a proxy for price) of panel shipments has decreased from $1.96 per peak kW in 2010 to $0.34 per peak kW in 2021, as solar became the third-largest renewable source and markets scaled. Despite supply chain constraints and higher material costs in 2021, the average value of solar panels decreased 11% from 2020.

In 2021, the top five destination states for U.S. solar panel shipments were:

California (5.09 million peak kW)
Texas (4.31 million peak kW)
Florida (1.80 million peak kW)
Georgia (1.15 million peak kW)
Illinois (1.12 million peak kW)
These five states accounted for 46% of all U.S. shipments, and 2023 utility-scale project pipelines point to continued growth.


Related News

View more

Wind Turbine Operations and Maintenance Industry Detailed Analysis and Forecast by 2025

Wind Turbine Operations and Maintenance Market is expanding as offshore and onshore renewables scale, driven by aging turbines, investment, UAV inspections, and predictive O&M services, despite skills shortages and rising logistics costs.


Key Points

Sector delivering inspection, repair, and predictive services to keep wind assets reliable onshore and offshore.

✅ Aging turbines and investor funding drive service demand

✅ UAV inspections and predictive analytics cut downtime

✅ Offshore growth offsets skills and logistics constraints


Wind turbines are capable of producing vast amounts of electricity at competitive prices, provided they are efficiently maintained and operated. Being a cleaner, greener source of energy, wind energy is also more reliable than other sources of power generation, with growth despite COVID-19 recorded across markets. Therefore, the demand for wind energy is slated to soar over the next few years, fuelling the growth of the global market for wind turbine operations and maintenance. By application, offshore and onshore wind turbine operations and maintenance are the two major segments of the market.


Global Wind Turbine Operations and Maintenance Market: Key Trends

The rising number of aging wind turbines emerges as a considerable potential for the growth of the market. The increasing downpour of funds from financial institutions and public and private investors has also been playing a significant role in the expansion of the market, with interest also flowing toward wave and tidal energy technologies that inform O&M practices. On the other hand, insufficient number of skilled personnel, coupled with increasing costs of logistics, remains a key concern restricting the growth of the market. However, the growing demand for offshore wind turbines across the globe is likely to materialize into fresh opportunities.


Global Wind Turbine Operations and Maintenance Market: Market Potential

A number of market players have been offering diverse services with a view to make a mark in the global market for wind turbine operations and maintenance. For instance, Scotland-based SgurrEnergy announced the provision of unmanned aerial vehicles (UAVs), commonly known as drones, as a part of its inspection services. Detailed and accurate assessments of wind turbines can be obtained through these drones, which are fitted with cameras, with four times quicker inspections than traditional methods, claims the company. This new approach has not only reduced downtime, but also has prevented the risks faced by inspection personnel.

The increasing number of approvals and new projects is preparing the ground for a rising demand for wind turbine operations and maintenance. In March 2017, for example, the Scottish government approved the installation of eight 6-megawatt wind turbines off the coast of Aberdeen, towards the northeast. The state of Maryland in the U.S. will witness the installation of a new offshore wind plant, encouraging greater adoption of wind energy in the country. The U.K., a leader in UK offshore wind deployment, has also been keeping pace with the developments, with the installation of a 400-MW offshore wind farm, off the Sussex coast throughout 2017. The Rampion project will be developed by E.on, who has partnered with Canada-based Enbridge Inc. and the UK Green Investment Bank plc.


Global Wind Turbine Operations and Maintenance Market: Regional Outlook

Based on geography, the global market for wind turbine operations and maintenance has been segmented into Asia Pacific, Europe, North America, and Rest of the World (RoW). Countries such as India, China, Spain, France, Germany, Scotland, and Brazil are some of the prominent users of wind energy and are therefore likely to account for a considerable share in the market. In the U.S., favorable government policies are backing the growth of the market, though analyses note that a prolonged solar ITC extension could pressure wind competitiveness. For instance, in 2013, a legislation that permits energy companies to transfer the costs of offshore wind credits to ratepayers was approved. Asia Pacific is a market with vast potential, with India and China being major contributors aiding the expansion of the market.


Global Wind Turbine Operations and Maintenance Market: Competitive Analysis

Some of the major companies operating in the global market for wind turbine operations and maintenance are Gamesa Corporacion Tecnologica, Xinjiang Goldwind Science & Technologies, Vestas Wind Systems A/S, Upwind Solutions, Inc, GE Wind Turbine, Guodian United Power Technology Company Ltd., Nordex SE, Enercon GmbH, Siemens Wind Power GmbH, and Suzlon Group. A number of firms have been focusing on mergers and acquisitions to extend their presence across new regions.


Related News

View more

Will EV Supply Miss the Demand Mark in the Short and Medium Term?

EV Carpocalypse signals potential mismatch between electric vehicle production and demand, as charging infrastructure, utility coordination, and plug-in hybrid strategies lag forecasts, while state mandates and market-share plays drive cautious, data-informed scaling.


Key Points

EV Carpocalypse describes overbuilt EV supply versus demand amid charging rollout, mandates, and risk-managed scaling.

✅ Forecasts vs actual EV demand may diverge in near term

✅ Charging infrastructure and utilities lag vehicle output

✅ Mandates and PHEVs cushion adoption while data guides scaling


According to Forbes contributor David Kiley, and Wards Automotive columnist John McElroy, there may be an impending “carpocalypse” of electric vehicles on the way. Sounds very damning and it’s certainly not the upbeat tone I’ve taken on nearly every piece of EV demand content I’ve authored but the author, Kiley does bring up some interesting points worth considering. EV Adoption is happening, and it’s certainly doing so at ever faster rates as the market nears an EV inflection point today. The infrastructure (charging stations, utility cooperation) is being built out more slowly than vehicle manufacturers are producing cars but, as the GM president on EV hurdles has noted, the issue seems to be just that, maybe even the short and medium term plans for EV manufacturing are too aggressive.

#google#

With new EV and plug-in hybrid vehicle sales representing a mere .6% of new car cales in the US, a sign that EV sales remain behind gas cars even as new models proliferate, car makers are are going to be spending more than $100 billion to come out with more than a hundred models of battery electric vheicles which also includes PHEVs and the fear is these vehicles aren’t going to sell in the numbers that automakers and industry analysts may have expected. But forecasts are just that, forecasts, even as U.S. EV sales surge into 2024 suggest momentum. So there’s a valid argument to be made that they’ll either overshoot the true mark or come in way below the actual amount. With nine U.S. states mandating that 15% of new cars sold be EVs by 2025, you could say that at least automakers have supporters in state government helping to push the new technology into the hands of more drivers.

Still, it’s anyone’s guess as to what true adoption will be, and a brief Q1 2024 market share dip underscores lingering volatility. The use of big data and just in time manufacturing will ensure that manufacturers will miss the mark on EVs by less than they have in the past, and will able to cope with breaking even on these vehicles for the sake of gobbling up precious early stage market share. After all, many vendors have up to this point been very willing to break even or make a loss on their lease-only EVs or on EV or hybrid financing in order to gain that share and build out their brand awareness and technical prowess. With some stops and starts, demand will meet supply or supply may need to meet demand but either way, the EV adoption wave is coming to a driveway near you. 


Related News

View more

Sign Up for Electricity Forum’s Newsletter

Stay informed with our FREE Newsletter — get the latest news, breakthrough technologies, and expert insights, delivered straight to your inbox.

Electricity Today T&D Magazine Subscribe for FREE

Stay informed with the latest T&D policies and technologies.
  • Timely insights from industry experts
  • Practical solutions T&D engineers
  • Free access to every issue

Live Online & In-person Group Training

Advantages To Instructor-Led Training – Instructor-Led Course, Customized Training, Multiple Locations, Economical, CEU Credits, Course Discounts.

Request For Quotation

Whether you would prefer Live Online or In-Person instruction, our electrical training courses can be tailored to meet your company's specific requirements and delivered to your employees in one location or at various locations.