More than half of new U.S. electric-generating capacity in 2023 will be solar


solar

NFPA 70e Training - Arc Flash

Our customized live online or in‑person group training can be delivered to your staff at your location.

  • Live Online
  • 6 hours Instructor-led
  • Group Training Available
Regular Price:
$199
Coupon Price:
$149
Reserve Your Seat Today

U.S. 2023 Utility-Scale Capacity Additions highlight surging solar power, expanding battery storage, wind projects, natural gas plants, and new nuclear reactors, boosting grid reliability in Texas and California with record planned installations.


Key Points

Planned grid expansions led by solar and battery storage, with wind, natural gas, and nuclear increasing U.S. capacity.

✅ 29.1 GW solar planned; Texas and California lead installations.

✅ 9.4 GW battery storage to more than double current capacity.

✅ Natural gas, wind, and 2.2 GW nuclear round out additions.


Developers plan to add 54.5 gigawatts (GW) of new utility-scale electric-generating capacity to the U.S. power grid in 2023, according to our Preliminary Monthly Electric Generator Inventory. More than half of this capacity will be solar power (54%), even as coal generation increase has been reported, followed by battery storage (17%).
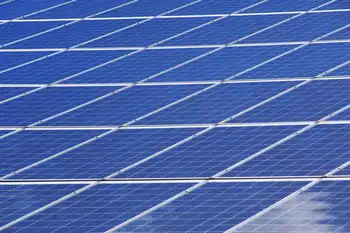
 

Solar

U.S. utility-scale solar capacity has been rising rapidly EIA summer outlook since 2010. Despite its upward trend over the past decade 2018 milestone, additions of utility-scale solar capacity declined by 23% in 2022 compared with 2021. This drop in solar capacity additions was the result of supply chain disruptions and other pandemic-related challenges. We expect that some of those delayed 2022 projects will begin operating in 2023, when developers plan to install 29.1 GW of solar power in the United States. If all of this capacity comes online as planned, 2023 will have the most new utility-scale solar capacity added in a single year, more than doubling the current record (13.4 GW in 2021).

In 2023, the most new solar capacity, by far, will be in Texas (7.7 GW) and California (4.2 GW), together accounting for 41% of planned new solar capacity.


Battery storage

U.S. battery storage capacity has grown rapidly January generation jump over the past couple of years. In 2023, U.S. battery capacity will likely more than double. Developers have reported plans to add 9.4 GW of battery storage to the existing 8.8 GW of battery storage capacity.

Battery storage systems are increasingly installed with wind and solar power projects. Wind and solar are intermittent sources of generation; they only produce electricity when the wind is blowing or the sun is shining. Batteries can store excess electricity from wind and solar generators for later use. In 2023, we expect 71% of the new battery storage capacity will be in California and Texas, states with significant solar and wind capacity.


Natural gas

Developers plan to build 7.5 GW of new natural-gas fired capacity record natural gas output in 2023, 83% of which is from combined-cycle plants. The two largest natural gas plants expected to come online in 2023 are the 1,836 megawatt (MW) Guernsey Power Station in Ohio and the 1,214 MW CPV Three Rivers Energy Center in Illinois.
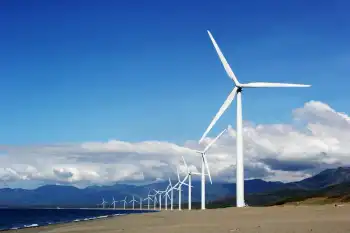
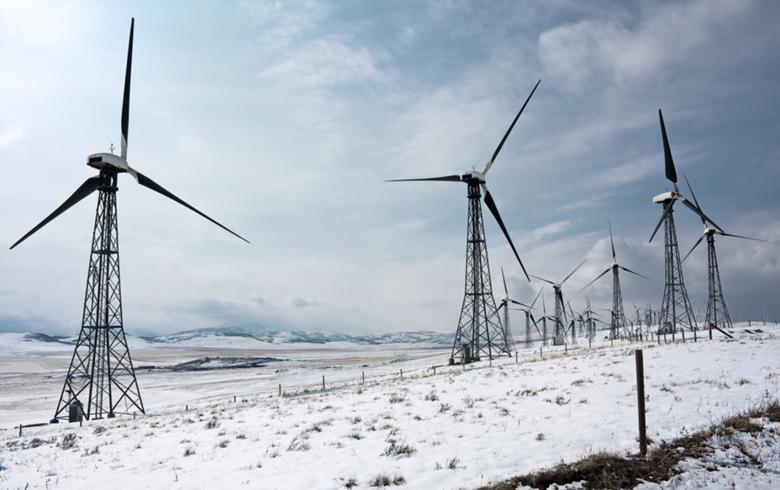
 

Wind

In 2023, developers plan to add 6.0 GW of utility-scale wind capacity, as renewables poised to eclipse coal in global power generation. Annual U.S. wind capacity additions have begun to slow, following record additions of more than 14 GW in both 2020 and 2021.

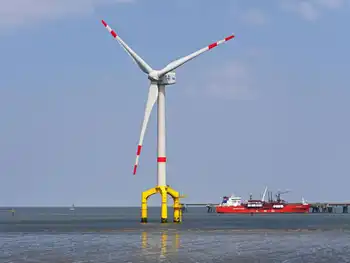
The most wind capacity will be added in Texas in 2023, at 2.0 GW. The only offshore wind capacity expected to come online this year is a 130.0 MW offshore windfarm in New York called South Fork Wind.


Nuclear

Two new nuclear reactors at the Vogtle nuclear power plant in Georgia nuclear and net-zero are scheduled to come online in 2023, several years later than originally planned. The reactors, with a combined 2.2 GW of capacity, are the first new nuclear units built in the United States in more than 30 years.

Developers and power plant owners report planned additions to us in our annual and monthly electric generator surveys. In the annual survey, we ask respondents to provide planned online dates for generators coming online in the next five years. The monthly survey tracks the status of generators coming online based on reported in-service dates.


Related News

Related News

What to know about DOE's hydrogen hubs

U.S. Clean Hydrogen Hubs aim to scale production, storage, transport, and use as DOE and the Biden administration fund regional projects under the infrastructure law, blending green and blue hydrogen, carbon capture, renewables, and pipelines.


Key Points

Federally funded regional projects to make, move, and use low-carbon hydrogen via green, blue, and pink routes.

✅ $7B DOE funding via infrastructure law

✅ Mix of green, blue, pink hydrogen pathways

✅ Targets 10M metric tons annually by 2030


New details are emerging about the Biden administration’s landmark plans to build out a U.S. clean hydrogen industry.

On Friday, the Department of Energy named the seven winners of $7 billion in federal funds to establish regional hydrogen hubs. The hubs — funded through the infrastructure law — are part of the administration’s efforts to jump-start an industry it sees as key to achieving climate goals like the goal of 100 percent clean electricity by 2035 set by the administration. The aim is to demonstrate everything from the production and storage of hydrogen to its transport and consumption.

“All across the country, from coast to coast, in the heartland, we’re building a clean energy future here in America, not somewhere else,” President Joe Biden said while announcing the hubs in Philadelphia.

From 79 initial proposals, DOE chose the following: the Mid-Atlantic Hydrogen Hub, Appalachian Hydrogen Hub, California Hydrogen Hub, Gulf Coast Hydrogen Hub, Heartland Hydrogen Hub, Midwest Hydrogen Hub and Pacific Northwest Hydrogen Hub.

Many of the winning proposals are backed by state government leaders and industry partners, and by Southeast cities that have ramped up clean energy purchases in recent years as well. The Midwest hub, for example, is a coalition of Illinois, Indiana and Michigan — supported by politicians like Illinois Gov. J.B. Pritzker (D), as well as such companies as Air Liquide, Ameren Illinois and Atlas Agro. The mid-Atlantic hub is supported by Democratic members of Congress representing the region, including Delaware Sens. Chris Coons and Tom Carper and Rep. Lisa Blunt Rochester.

The administration hopes the hubs will produce 10 million metric tons of “clean” hydrogen annually by 2030. But much about the projects remains unknown — including how trends like cheap batteries for solar could affect clean power supply — and dependent on negotiations with DOE.


A win for ‘blue’ hydrogen?
Nearly all hydrogen created in the U.S. today is extracted from natural gas through steam methane reformation. The emissions-intensive process produces what is known as “grey” hydrogen — or “blue” hydrogen when combined with carbon capture and storage.

Four recipients — the Appalachian, Gulf Coast, Heartland and Midwest hydrogen hubs — include blue hydrogen in their plans, though the infrastructure law only mandated one.

That has drawn the ire of environmentalists, who argue blue hydrogen is not emissions-free, partly because of the potential for methane leaks during the production process.

“This is worse than expected,” Clean Energy Group President Seth Mullendore said after the recipients were announced Friday. “The fact that more than half the hubs will be using fossil gas is outrageous.”

Critics have also pointed out that many of the industry partners backing the hub projects include oil and gas companies. The coalitions are a mix of private-sector groups — often including renewable energy developers — and government stakeholders. Proposals have also looped in universities, utilities, environmental groups, community organizations, labor unions and tribal nations, among others.

“The massive build out of hydrogen infrastructure is little more than an industry ploy to rebrand fracked gas,” said Food & Water Watch Policy Director Jim Walsh in a statement Friday. “In a moment when every political decision that we make must reject fossil expansion, the Biden administration is going in the opposite direction.”

The White House has emphasized that roughly two-thirds of the $7 billion pot is “associated” with the production of “green” hydrogen, which uses electricity from renewable sources. Two of the chosen proposals — in California and the Pacific Northwest — are making green hydrogen their focus, reflecting advances such as offshore green hydrogen being pursued by industry leaders, while three other hubs plan to include green hydrogen alongside hydrogen made with natural gas (blue) or nuclear energy (pink).

Many hubs plan to use several methods for hydrogen production, and globally, projects like Brazil's green hydrogen plant highlight the scale of investment, but the exact mix may change depending on which projects make it through the DOE negotiations process. The Midwest hub, for example, told E&E News it’s pursuing an “all-of-the-above” strategy and has projects for green, blue and “pink” hydrogen. The mid-Atlantic hub in southeastern Pennsylvania, Delaware and New Jersey will also generate hydrogen with nuclear reactors.

Energy Secretary Jennifer Granholm has described clean hydrogen as a fresh business opportunity, especially for the natural gas industry, which has supported the concept of sending hydrogen to market through its pipeline network. Lawmakers like Sen. Joe Manchin (D-W.Va.) — who said the Appalachian hub will make West Virginia the “new epicenter of hydrogen” — have pushed for continuing to use natural gas to make hydrogen in his state.

“Natural gas utilities are committed to exploring all options for emissions reduction as demonstrated by the 39 hydrogen pilot projects already underway and are eager to participate in a number of the hubs,” said American Gas Association President and CEO Karen Harbert in a statement Friday.

Green hydrogen also has faced criticism. Some groups argue that the renewable resources needed to produce green hydrogen are limited, even with sources such as wind, solar and hydropower technology, so funding should be reserved for applications that cannot be easily electrified, mostly industrial processes. There also is uncertainty about how the Treasury Department will handle hydrogen made from grid electricity — which can include power from fossil fuel plants — in its upcoming guidance on the first-ever tax credit for clean hydrogen production.

“Even the cleanest forms of hydrogen present serious problems,” Walsh said. “As groundwater sources are drying up across the country, there is no reason to waste precious drinking water resources on hydrogen when there are cheaper, cleaner energy sources that can facilitate a real transition off fossil fuels.”

But Angelina Galiteva, CEO of the hub in drought-prone California, said hydrogen will enable the state “to increase renewable penetration to reach all corners of the economy,” noting parallel initiatives such as Dubai's solar hydrogen plans that illustrate the potential.

“Transitioning to renewable clean hydrogen will pose significantly less stress on water resources than remaining on the current fossil path,” she said.


Related News

View more

World Bank helps developing countries wind spurt

World Bank Offshore Wind Investment drives renewables and clean energy in developing countries, funding floating turbines and shallow-water foundations to replace fossil fuels, expand grids, and scale climate finance across Latin America, Africa, and Asia.


Key Points

A World Bank program funding offshore wind to speed clean power, cut fossil fuels, and expand grids in emerging markets.

✅ US$80bn to 565 onshore wind projects since 1995

✅ Pilot funds offshore wind in Asia, Africa, Latin America

✅ Floating turbines and shallow-water foundations enable deep resources


Europe and the United States now accept onshore wind power as the cheapest way to generate electricity, and U.S. lessons from the U.K. are informing policy discussions. But this novel technology still needs subsidising before some developing countries will embrace it. Enter the World Bank.

A total of US$80 billion in subsidies from the Bank has gone over 25 years to 565 developing world onshore wind projects, to persuade governments to invest in renewables rather than rely on fossil fuels.

Central and Latin American countries have received the lions share of this investment, but the Asia Pacific region and Eastern Europe have also seen dozens of Bank-funded developments. Now the fastest-growing market is in Africa and the Middle East, where West African hydropower support can complement variable wind resources.

But while continuing to campaign for more onshore wind farms, the World Bank in 2019 started encouraging target countries to embrace offshore wind as well. This uses two approaches: turbines in shallow water, which are fixed to the seabed, and also a newer technology, involving floating turbines anchored by cables at greater depth.

The extraordinary potential for offshore wind, which is being commercially developed very fast in Europe, including the UK's offshore expansion, China and the U.S. offshore wind sector today as well, is now seen by the Bank as important for countries like Vietnam which could harness enough offshore wind power to provide all its electricity needs.

Other countries it has identified with enormous potential for offshore wind include Brazil, Indonesia, India, the Philippines, South Africa and Sri Lanka, all of them countries that need to keep building more power stations to connect every citizen to the national grid.

The Bank began investing in wind power in 1995, with its spending reaching billions of dollars annually in 2011. The biggest single recipient has been Brazil, receiving US$24.2 bn up to the end of 2018, 30 per cent of the total the Bank has invested worldwide.

Many private companies have partnered with the Bank to build the wind farms. The biggest single beneficiary is Enel, the Italian energy giant, which has received US$6.1 bn to complete projects in Brazil, Mexico, South Africa, Romania, Morocco, Bulgaria, Peru, and Russia.

Among the countries now benefitting from the Banks continuing onshore wind programme are Egypt, Morocco, Senegal, Jordan, Vietnam, Thailand, Indonesia and the Philippines.

Offshore wind now costs less than nuclear power, and global costs have fallen enough to compete in most countries with fossil fuels. Currently the fastest-growing industry in the world, it continued to grow despite Covid-19 across most markets.

Persistent coal demand

Particularly in Asia, some countries are continuing to burn large quantities of coal and are considering investing in yet more fossil fuel generation unless they can be persuaded that renewables are a better option, with an offshore wind $1 trillion outlook underscoring the scale.

Last year the World Bank began a pilot scheme to explore funding investment in offshore wind in these countries. Launching the scheme Riccardo Puliti, a senior director at the Bank, said: Offshore wind is a clean, reliable and secure source of energy with massive potential to transform the energy mix in countries that have great wind resources.

We have seen it work in Europe we can now make use of global experience to scale up offshore wind projects in emerging markets.

Using data from the Global Wind Atlas, the Bank calculated that developing countries with shallow waters like India, Turkey and Sri Lanka had huge potential with fixed turbines, while others the Philippines and South Africa, for example would need floating foundations to reach greater depths, up to 1,000 metres.

For countries like Vietnam, with a mix of shallow and deep water, wind power could solve their entire electricity needs. In theory offshore wind power could produce ten times the amount of electricity that the country currently gets from all its current power stations, the Bank says.


Related News

View more

Fact check: Claim on electric car charging efficiency gets some math wrong

EV Charging Coal and Oil Claim: Fact-check of kWh, CO2 emissions, and electricity grid mix shows 70 lb coal or ~8 gallons oil per 66 kWh, with renewables and natural gas reducing lifecycle emissions.


Key Points

A viral claim on EV charging overstates oil use; accurate figures depend on grid mix: ~70 lb coal or ~8 gallons oil.

✅ About 70 lb coal or ~8 gal oil per 66 kWh, incl. conversion losses

✅ EVs average ~100 g CO2 per mile vs ~280 g for 30 mpg cars

✅ Grid mix includes renewables, nuclear, natural gas; oil use is low


The claim: Average electric car requires equivalent of 85 pounds of coal or six barrels of oil for a single charge

The Biden administration has pledged to work towards decarbonizing the U.S. electricity grid by 2035. And the recently passed $1.2 trillion infrastructure bill provides funding for more electric vehicle (EV) charging infrastructure, including EV charging networks across the country under current plans.

However, a claim that electric cars require an inordinate amount of oil or coal energy to charge has appeared on social media, even as U.S. plug-ins traveled 19 billion miles on electricity in 2021.

“An average electric car takes 66 KWH To charge. It takes 85 pounds of coal or six barrels of oil to make 66 KWH,” read a Dec 1 Facebook post that was shared nearly 500 times in a week. “Makes absolutely no sense.” 

The post included a stock image of an electric car charging, though actual charging costs depend on local rates and vehicle efficiency.

This claim is in the ballpark for the coal comparison, but the math on the oil usage is wildly inaccurate.

It would take roughly 70 pounds of coal to produce the energy required to charge a 66 kWh electric car battery, said Ian Miller, a research associate at the MIT Energy Initiative. That's about 15 pounds less than is claimed in the post.

The oil number is much farther off.

While the post claims that it takes six barrels of oil to charge a 66 kWh battery, Miller said the amount is closer to 8 gallons  — the equivalent of 20% of one barrel of oil.

He said both of his estimates account for energy lost when fossil fuels are converted into electricity. 

"I think the most important question is, 'How do EVs and gas cars compare on emissions per distance?'," said Miller. "In the US, using average electricity, EVs produce roughly 100 grams of CO2 per mile."

He said this is more than 60% less than a typical gasoline-powered car that gets 30 mpg, aligning with analyses that EVs are greener in all 50 states today according to recent studies. Such a vehicle produces roughly 280 grams of CO2 per mile.

Lifecycle analyses also show that the CO2 from making an EV battery is not equivalent to driving a gasoline car for years, which often counters common misconceptions.

"If you switch to an electric vehicle, even if you're using fossil fuels (to charge), it's just simply not true that you'll be using more fossil fuel," said Jessika Trancik, a professor at the Massachusetts Institute of Technology who studies the environmental impact of energy systems.  

However, she emphasized electric cars in the U.S. are not typically charged using only energy from coal or oil, and that electricity grids can handle EVs with proper management.

The U.S. electricity grid relies on a diversity of energy sources, of which oil and coal together make up about 20 percent, according to a DOE spokesperson. This amount is likely to continue to drop as renewable energy proliferates in the U.S., even as some warn that state power grids will be challenged by rapid EV adoption. 

"Switching to an electric vehicle means that you can use other sources, including less carbon-intensive natural gas, and even less carbon-intensive electricity sources like nuclear, solar and wind energy, which also carry with them health benefits in the form of reduced air pollutant emissions," said Trancik. 

Our rating: Partly false
Based on our research, we rate PARTLY FALSE the claim that the average electric car requires the equivalent of 85 pounds of coal or six barrels of oil for a single charge. The claim is in the ballpark on coal consumption, as an MIT researcher estimates that around 70 pounds. But the oil usage is only about 8 gallons, which is 20% of one barrel. And the actual sources of energy for an electric car vary depending on the energy mix in the local electric grid. 


Related News

View more

California Takes the Lead in Electric Vehicle and Charging Station Adoption

California EV Adoption leads the U.S., with 37% of registered electric vehicles and 27% of charging locations, spanning Level 1, Level 2, and DC Fast stations, aligned with OCPI and boosted by CALeVIP funding.


Key Points

California EV adoption reflects the state's leading EV registrations and growth in private charging infrastructure.

✅ 37% of U.S. EVs, 27% of charging locations in 2022

✅ CALeVIP funding boosts public charging deployment

✅ OCPI-aligned data; EVs per charger rose to 75 in CA


California has consistently been at the forefront of electric vehicle (EV) adoption, with EV sales topping 20% in California underscoring this trend, and the proliferation of EV charging stations in the United States, maintaining this position since 2016. According to recent estimates from our State Energy Data System (SEDS), California accounts for 37% of registered light-duty EVs in the U.S. and 27% of EV charging locations as of the end of 2022.

The vehicle stock data encompass all registered on-road, light-duty vehicles and exclude any previous vehicle sales no longer in operation. The data on EV charging locations include both private and public access stations for Legacy, Level 1, Level 2, and DC Fast charging ports, excluding EV chargers in single-family residences. There is a data series break between 2020 and 2021, when the U.S. Department of Energy updated its data to align with the Open Charge Point Interface (OCPI) international standard, reflecting changes in the U.S. charging infrastructure landscape.

In 2022, the number of registered EVs in the United States, with U.S. EV sales soaring into 2024 nationwide, surged to six times its 2016 figure, growing from 511,600 to 3.1 million, while the number of U.S. charging locations nearly tripled, rising from 19,178 to 55,015. Over the same period, California saw its registered EVs more than quadruple, jumping from 247,400 to 1.1 million, and its charging locations tripled, increasing from 5,486 to 14,822.

California's share of U.S. EV registrations has slightly decreased in recent years as EV adoption has spread across the country, with Arizona EV ownership relatively high as well. In 2016, California accounted for approximately 48% of light-duty EVs in the United States, which was approximately 12 times more than the state with the second-highest number of EVs, Georgia. By 2022, California's share had decreased to around 37%, which was still approximately six times more than the state with the second-most EVs, Florida.

On the other hand, California's share of U.S. EV charging locations has risen slightly in recent years, as charging networks compete amid federal electrification efforts and partly due to the California Electric Vehicle Infrastructure Project (CALeVIP), which provides funding for the installation of publicly available EV charging stations. In 2016, approximately 25% of U.S. EV charging locations were in California, over four times as many as the state with the second-highest number, Texas. In 2022, California maintained its position with over four times as many EV charging locations as the state with the second-most, New York.

The growth in the number of registered EVs has outpaced the growth of EV charging locations in the United States, and in 2021 plug-in vehicles traveled 19 billion electric miles nationwide, underscoring utilization. In 2016, there were approximately 27 EVs per charging location on average in the country. Alaska had the highest ratio, with 67 EVs per charging location, followed by California with 52 vehicles per location.

In 2022, the average ratio was 55 EVs per charging location in the United States, raising questions about whether the grid can power an ongoing American EV boom ahead. New Jersey had the highest ratio, with 100 EVs per charging location, followed by California with 75 EVs per location.


Related News

View more

Use of electric vehicles associated with fewer asthma-related ER visits on a local level, study shows

Electric Vehicle Adoption Benefits include reduced air pollution, lower greenhouse gas emissions, and improved respiratory health, as regional studies show, with equity considerations for low-income communities and policy mandates accelerating zero-emission vehicles.


Key Points

The environmental and health gains from wider EV uptake, including cleaner air, lower emissions, and fewer asthma cases.

✅ Regional EV growth linked to lower NO2 and PM2.5 levels

✅ Fewer asthma ER visits in higher EV-adoption areas

✅ Address adoption gap to ensure equity in low-income communities


In an effort to mitigate the effects of climate change, countries across the globe are involving electric vehicles in their plans to reduce greenhouse gas emissions, citing the EV climate and cost benefits highlighted by recent analyses.

A federal mandate in Canada, for instance, aims to ensure that one-fifth of all passenger cars, SUVs and trucks sold in Canada are electrically-powered by 2026, with Ottawa set to release EV sales regulations to guide industry. By 2035, if this mandate is carried out, every passenger vehicle sold in Canada will need to be electric, though some critics deem the 2035 target unrealistic based on current conditions.

But what will this shift to electric vehicles actually do for the environment, especially given that 18% of Canada's 2019 electricity came from fossil fuels which affects lifecycle emissions?

One team of researchers with the Keck School of Medicine of USC aimed to find out, conducting what it describes as one of the first studies to analyze the environmental and health impacts of electric vehicles on a regional scale. Their research linked the wider integration of zero-emission vehicles with lower levels of local air pollution and some respiratory problems, a pattern consistent with analyses showing EVs are greener across all 50 states in the U.S.

“When we think about the actions related to climate change, often it’s on a global level,” Erika Garcia, an assistant professor of population and public health at the Keck School of Medicine, said in a press release.

“But the idea that changes being made at the local level can improve the health of your own community could be a powerful message to the public and to policy makers.”

Using data that spanned from 2013 to 2019, Garcia and the team of researchers compared the registration of zero-emissions vehicles with air pollution levels and asthma-related emergency room visits in California. They found that in regions where more electric vehicles were adopted, emergency room visits dropped, along with with pollution levels.

Sandrah Eckel, an associate professor of population and public health sciences and the study’s senior author, said their findings offer hope among a reality of climate anxieties.

“We’re excited about shifting the conversation towards climate change mitigation and adaptation, and these results suggest that transitioning to [electric vehicles] is a key piece of that.”

Garcia added that the study also evaluated disadvantages faced by those living in lower-income communities, which often see higher pollution levels and related respiratory problems, underscoring that EVs are not a silver bullet in broader climate and health policy.

Researchers discovered that adoption of zero-emissions vehicles in low-resource neighbourhoods was slower compared to more affluent areas, amid ongoing debate over whether EV purchase subsidies are an effective tool for Canada.

The study attributes this disparity to what the researchers call an “adoption gap” – referring to groups of people that cannot afford newer vehicles that are electrically-powered.


According to the study, which was published in the journal Science of the Total Environment, the adoption gap “threatens the equitable distribution of possible co-benefits.”

“Should continuing research support our findings, we want to make sure that those communities that are overburdened with traffic-related air pollution are truly benefiting from this climate mitigation effort,” Garcia said in the release.


Related News

View more

DOE Issues Two LNG Export Authorizations

DOE LNG Export Approvals expand flexibility for Cheniere's Sabine Pass and Corpus Christi to ship to non-FTA countries, boosting U.S. supply to Europe while advancing methane emissions reductions and strengthening global energy security.


Key Points

DOE LNG export approvals authorize Sabine Pass and Corpus Christi to sell full-capacity LNG to non-FTA markets.

✅ Exports allowed to any non-FTA country, including Europe

✅ Capacity covers Sabine Pass and Corpus Christi terminals

✅ DOE targets methane reductions across oil and gas


The U.S. Department of Energy (DOE) today issued two long-term orders authorizing liquefied natural gas (LNG) exports from two current operating LNG export projects, Cheniere Energy Inc.’s Sabine Pass in Louisiana and Corpus Christi in Texas, following a recent deep freeze that slammed the American energy sector.

The two orders allow Sabine Pass and Corpus Christi additional flexibility to export the equivalent of 0.72 billion cubic feet per day of natural gas as LNG to any country with which the U.S. does not have a free trade agreement, including all of Europe, such as the UK natural gas market as well.

While U.S. exporters are already exporting at or near their maximum capacity, with today's issuances, every operating U.S. LNG export project has approval from DOE to export its full capacity to any country where not prohibited by U.S. law or policy constraints in place.

The U.S. is now the top global exporter of LNG and exports are set to grow an additional 20% beyond current levels by the end of this year as additional capacity comes online, even as a domestic energy crisis influences electricity and gas markets.  In January 2022, U.S. LNG supplied more than half of the LNG imports into Europe for the month.

With the expected rise in LNG exports, DOE is particularly focused on driving down methane emissions in the oil and gas sector both domestically and abroad, leveraging the deep technical expertise of the Department, and supporting nuclear innovation as well.

U.S. LNG remains an important component to global energy security worldwide and DOE remains committed to finding ways to help our allies and trading partners, including support to Ukraine and others with the energy supplies they need while continuing to work to mitigate the impact of climate change.


Related News

View more

Sign Up for Electricity Forum’s Newsletter

Stay informed with our FREE Newsletter — get the latest news, breakthrough technologies, and expert insights, delivered straight to your inbox.

Electricity Today T&D Magazine Subscribe for FREE

Stay informed with the latest T&D policies and technologies.
  • Timely insights from industry experts
  • Practical solutions T&D engineers
  • Free access to every issue

Download the 2025 Electrical Training Catalog

Explore 50+ live, expert-led electrical training courses –

  • Interactive
  • Flexible
  • CEU-cerified