
Substation Relay Protection Training
Our customized live online or in‑person group training can be delivered to your staff at your location.

- Live Online
- 12 hours Instructor-led
- Group Training Available
Regular Price:
$699
Coupon Price:
$599
PROVIDENCE
—
Rhode Island 100% Renewable Electricity by 2030 outlines pathways via offshore wind, retail solar, RECs, and policy reforms, balancing decarbonization, grid reliability, economics, and equity to close a 4,600 GWh supply gap affordably.
Key Highlights
A statewide plan to meet all electricity demand with renewables by 2030 via offshore wind, solar, and REC policies.
Needs ~4,600 GWh more renewables to meet 2030 demand.
600 MW offshore wind could supply ~2,700 GWh per year.
Retail solar growth may add about 1,500 GWh annually.
Bill impacts: +$11-$14 monthly with utility-scale, up to $30 with retail solar.
A year ago, Executive Order 20-01 cemented in a place Rhode Island’s goal to meet 100% of the state’s electricity demand with renewable energy by 2030, aligning with the road to 100% renewables seen across states. The Rhode Island Office of Energy Resources (OER) worked through the year on an economic and energy market analysis, and developed policy and programmatic pathways to meet the goal.
In the most recent development, OER and The Brattle Group co-authored a report detailing how this goal will be achieved, The Road to 100% Renewable Electricity – The Pathways to 100%.
The report includes economic analysis of the key factors that will guide Rhode Island as it accelerates adoption of carbon-free renewable resources, complementing efforts that are tracking progress on 100% clean energy targets nationwide.
The pathway rests on three principles: decarbonization, economics and policy implementation, goals echoed in Maine’s 100% renewable electricity target planning.
The report says the state needs to address the gap between projected electricity demand in 2030 and projected renewable generation capacity. The report predicts a need for 4,600 GWh of additional renewable energy to close the gap. Deploying that much capacity represents a 150% increase in the amount of renewable energy the state has procured to date. The final figure could as much as 600-700 GWh higher or lower.
Addressing the gap
The state is making progress to close the gap.
Rhode Island recently announced plans to solicit proposals for up to 600 MW of additional offshore wind resources. A draft request for proposals (RFP) is expected to be filed for regulatory review in the coming months, aligning with forecasts that one-fourth of U.S. electricity will soon be supplied by renewables as markets mature. Assuming the procurement is authorized and the full 600 MW is acquired, new offshore wind would add about 2,700 GWh per year, or about 35% of 2030 electricity demand.
Beyond this offshore wind procurement, development of retail solar through existing programs could add another 1,500 GWh per year. That leaves a smaller–though still sizable–gap of around 400 GWh per year of renewable electricity.
All this capacity will come with a hefty price. The report finds that rate impacts would likely boost e a typical 2030 monthly residential bill by about $11 to $14 with utility-scale renewables, or by as much as $30 if the entire gap were to be filled with retail solar.
The upside is that if the renewable resources are developed in-state, the local economic activity would boost Rhode Island’s gross domestic product and local jobs, especially when compared to procuring out-of-state resources or buying Renewable Energy Credits (RECs), and comes as U.S. renewable electricity surpassed coal in 2022 across the national grid.
Policy recommendations
One policy item that has to be addressed is the state’s Renewable Energy Standard (RES), which currently calls for meeting 38.5% of electricity deliveries with renewables by 2035, even as the federal 2035 clean electricity goal sets a broader benchmark for decarbonization. For example, RES compliance at present does not require the physical procurement of power produced by renewable energy facilities. Instead, electricity providers meet their requirements by purchasing RECs.
The report recommends amending the state’s RES to seek methods by which Rhode Island can retain all of the RECs procured through existing policy and program channels, along with RECs resulting from ratepayer investment in net metered projects, while Nevada’s 50% by 2030 RPS provides a useful interim comparison.
The report also recognizes that the RES alone is unlikely to drive sufficient investment renewable generation and should be paired with programs and policies to ensure sufficient renewable generation to meet the 100% goal. The state also needs to address the RECs created by behind-the-meter systems that add mechanisms to better match the timing of renewable energy generation with real-time demand. The policy would have the 100% RES remain in effect beyond 2030 and also match shifts in energy demand, particularly as other parts of the economy electrify.
Fostering equity
The state also is putting a high priority on making sure the transition to renewables is an equitable one.
The report recommends partnering with and listening to frontline communities about their needs and goals in the clean energy transition. This will include providing traditionally underserved communities with expert consultation to help guide decision making. The report also recommends holding listening sessions to increase accessibility to and understanding of energy system basics.
Related News
Related News

Bus depot bid to be UK's largest electric vehicle charging hub
First Glasgow Electric Buses will transform the Caledonia depot with 160 charging points, zero-emission operations,…
View more

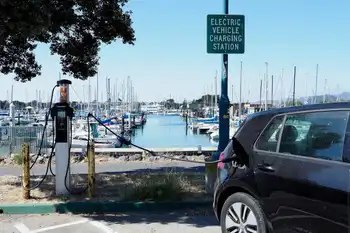
California Takes the Lead in Electric Vehicle and Charging Station Adoption
California EV Adoption leads the U.S., with 37% of registered electric vehicles and 27% of…
View more

Electricity or hydrogen - What is the future of vehicles?
Hydrogen vs Battery-Electric Vehicles compare FCEV and BEV tech for range, charging and refueling, zero-emissions,…
View more
CO2 output from making an electric car battery isn't equal to driving a gasoline car for 8 years
EV Battery Manufacturing Emissions debunk viral claims with lifecycle analysis, showing lithium-ion production CO2 depends…
View more
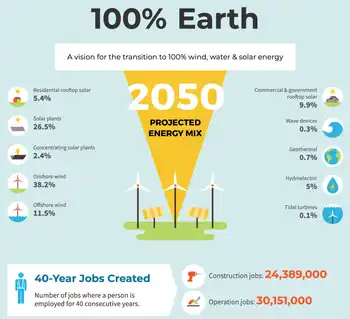
Renewables Are Ready to Deliver a Renewable World - Time for Action for 100% Renewable Energy Globally
100% Renewable Energy Transition unites solar, wind, hydropower, geothermal, and bioenergy with storage, smart grids,…
View more

Use of electric vehicles associated with fewer asthma-related ER visits on a local level, study shows
Electric Vehicle Adoption Benefits include reduced air pollution, lower greenhouse gas emissions, and improved respiratory…
View more
Sign Up for Electricity Forum’s Newsletter
Stay informed with our FREE Newsletter — get the latest news, breakthrough technologies, and expert insights, delivered straight to your inbox.
Electricity Today T&D Magazine Subscribe for FREE

Stay informed with the latest T&D policies and technologies.
- Timely insights from industry experts
- Practical solutions T&D engineers
- Free access to every issue

