
CSA Z462 Arc Flash Training – Electrical Safety Compliance Course
Our customized live online or in‑person group training can be delivered to your staff at your location.

- Live Online
- 6 hours Instructor-led
- Group Training Available
Regular Price:
$249
Coupon Price:
$199
BOSTON
—
Massachusetts Energy Storage Solicitation offers grants and matching funds via MassCEC and DOER for grid-connected, behind-the-meter projects, utility partners, and innovative business models, targeting 600 MW, clean energy leadership, and ratepayer savings.
The Situation Explained
MassCEC and DOER matching-fund program for grid-connected storage pilots, advancing innovation and ratepayer savings.
Funding: $100k-$1.25M matching per project; 10-15 awards expected.
Eligible: grid-connected behind-the-meter and distribution-scale pilots.
Priority: utility partnerships; ~50% of funds to utility-involved projects.
Goals: 600 MW storage, ratepayer savings, clean energy leadership.
Timeline: proposals due Jun 9; awards Sep 8; install within 18 months.
Massachusetts released a much-awaited energy storage solicitation on Thursday offering up to $10 million for new projects.
Issued by the Massachusetts Clean Energy Center (MassCEC) and the Department of Energy Resources (DOER), the solicitation makes available $100,000 to $1.25 million in matching funds for each chosen project.
The solicitation springs from a state report issued last year that found Massachusetts could save electricity ratepayers $800 million by incorporating 600 MW of energy storage projects. The state plans to set a specific energy storage goal, now the subject of a separate proceeding before the DOER.
The state is offering money for projects that showcase examples of future storage deployment, help to grow the state’s energy storage economy, and contribute to the state’s clean energy innovation leadership.
MassCEC anticipates making about 10-15 awards. Applicants must supply at least 50 percent of total project cost.
The state plans to allot about half of the money from the energy storage solicitation to projects that include utility partners. Both distribution scale and behind-the-meter projects, including net-zero buildings among others, will be considered, but must be grid connected.
The solicitation seeks innovative business models that showcase the commercial value of energy storage in light of the specific local energy challenges and opportunities in Massachusetts.
Projects also should demonstrate multiple benefits/value streams to ratepayers, the local utility, or wholesale market.
And finally, projects should help uncover market and regulatory issues as well as monetization and financing barriers.
The state anticipates teams forming to apply for the grants. Teams may include public and private entities and are are encouraged to include the local utility.
Proposals are due June 9. The state expects to notify winners September 8, with contracts issued within the following month. Projects must be installed within 18 months of receiving contracts.
Related News
Related News

Feds announce $500M contract with Edmonton company for green electricity
Canada Renewable Energy Partnerships advance wind power and clean electricity in Alberta and Saskatchewan, cutting…
View more

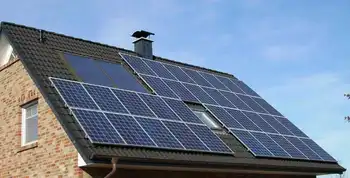
Solar panel sales double in the UK as homeowners look to cut soaring bills
UK Home Solar Panel Installation drives self-consumption as PV panels, hybrid inverters, and smart meters…
View more
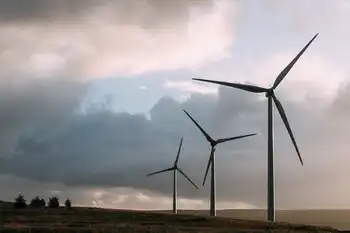
Wind Turbine Operations and Maintenance Industry Detailed Analysis and Forecast by 2025
Wind Turbine Operations and Maintenance Market is expanding as offshore and onshore renewables scale, driven…
View more
Is residential solar worth it?
Home Solar Cost vs Utility Bills compares electricity rates, ROI, incentives, and battery storage, explaining…
View more
Climate change, not renewables, threaten grid
New Mexico Energy Transition Act advances renewable energy, battery storage, energy efficiency, and demand response…
View more
Why the Texas grid causes the High Plains to turn off its wind turbines
Texas High Plains Wind Energy faces ERCOT transmission congestion, limiting turbines in the Panhandle from…
View more
Sign Up for Electricity Forum’s Newsletter
Stay informed with our FREE Newsletter — get the latest news, breakthrough technologies, and expert insights, delivered straight to your inbox.
Electricity Today T&D Magazine Subscribe for FREE

Stay informed with the latest T&D policies and technologies.
- Timely insights from industry experts
- Practical solutions T&D engineers
- Free access to every issue

