Opinion: Would we use Site C's electricity?


Site C Dam Construction

CSA Z463 Electrical Maintenance

Our customized live online or in‑person group training can be delivered to your staff at your location.

  • Live Online
  • 6 hours Instructor-led
  • Group Training Available
Regular Price:
$249
Coupon Price:
$199
Reserve Your Seat Today

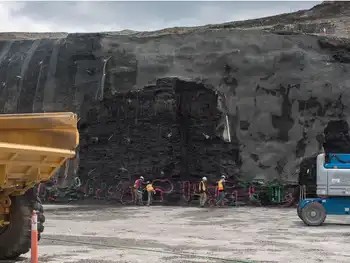
Site C Dam Electricity Demand underscores B.C.'s decarbonization path, enabling electrification of EVs, heat pumps, and industry, aligning with BC Hydro forecasts and 2030/2050 GHG targets to supply dependable, renewable baseload power.


Key Points

Projected clean power tied to Site C, driven by B.C. electrification to meet 2030 and 2050 greenhouse gas targets.

✅ Aligns with 25-30% by 2030 and 55-70% by 2050 GHG cuts

✅ Supports EVs, heat pumps, and industrial electrification

✅ Provides dependable baseload alongside efficiency gains


There are valid reasons not to build the Site C dam. There are also valid reasons to build it. One of the latter is the rapid increase in clean electricity needed to reduce B.C.’s greenhouse gas emissions from burning natural gas, gasoline, diesel and other harmful fossil fuel products.

Although former Premier Christy Clark casually avoided near-term emissions targets, Prime Minister Justin Trudeau has set Canadian targets for both 2030 and 2050, and cleaning up Canada's electricity is critical to meeting them. Studies by my research group at Simon Fraser University and other independent analysts show that B.C.’s cost-effective contribution to these national targets requires us to reduce our emissions 25 to 30 per cent by 2030 and 55 to 70 per cent by 2050 — an energy evolution involving, among other things, a much greater use of electricity in buildings, vehicles and industry.

Recent submissions to the Site C hearing have offered widely different estimates of B.C.’s electricity demand in the decade after the project’s completion in 2025, some arguing the dam’s output will be completely surplus to domestic need for years and perhaps decades, even though improved B.C.-Alberta grid links could help balance regional demand. Some of this variation in demand forecasts is understandable. Industrial demand is especially difficult to predict, dependent as it is on global economic conditions and shifting trade relations. And there are legitimate uncertainties about B.C. Hydro’s ability to reduce electricity demand by promoting efficient products and behaviour through its Power Smart program. But some of the forecasts appear to be deliberate exaggerations, designed to support fixed positions for or against Site C.

Our university-based research team models the energy system changes required to meet national and provincial emissions targets, and we have been comparing estimates of the electricity demand implications. These estimates are produced by academics, as well as by key institutions like B.C. Hydro, the National Energy Board, and the governments of Canada and B.C.

Most electricity forecasts for B.C., including the most recent by B.C. Hydro, do not assume that B.C. reduces its greenhouse gas emissions by 25 to 30 per cent by 2030 and 55 to 70 per cent by 2050. When we adjust Hydro’s forecast for just the low end of these targets, we find that in its latest, August 30, submission to the Site C hearing, which followed the premier’s over-budget go-ahead on the project, Hydro has underestimated the demand for its electricity by about three terawatt-hours in 2025, four in 2030 and 10 in 2035. Hydro’s forecast indicates that it will need the five terawatt-hours from Site C. Our research shows that even if Hydro’s demand forecast is too high, appropriate climate policy nationally and in B.C. will absorb all the electricity the dam can produce soon after its completion.

B.C. Hydro does not forecast electricity demand to 2050. But, studies by us and others show that B.C. electricity demand will be almost double today’s levels if we are to reduce emissions by 55 to 70 per cent, even amid a documented risk of missing the 2050 target, in just over three decades while our population, economy, buildings and equipment grow significantly. Most mid- and small-sized vehicles will be electric. Most buildings will be well insulated and heated by electric resistance or electric heat-pumps, either individually or via district heating systems. And many low temperature industrial applications will be electric.

Aggressive efforts to promote energy efficiency will make an important contribution, such that energy demand will not grow nearly as fast as the economy. But it is delusional to think that humans will stop using energy. Even climate policy scenarios in which we assume unprecedented success with energy efficiency show dramatic increases in the consumption of electricity, this being the most favoured zero-emission form of energy as a replacement for planet-destroying gasoline and natural gas.

The completion of the Site C dam is a complicated and challenging societal choice, and delay-related cost risks highlighted by the premier underscore the stakes. There is unbiased evidence and argument supporting either completion or cancellation. But let’s stick to the unbiased evidence. In the case of our 2030 and 2050 greenhouse gas reduction targets, such evidence shows that we must substantially increase our generation of dependable electricity. If the Site C dam is built, and if we are true to our climate goals, all its electricity will be used in B.C. soon after completion.

Mark Jaccard is a professor of sustainable energy in the School of Resource and Environmental Management at Simon Fraser University.


Related News

Related News

Electricity sales in the U.S. actually dropped over the past 7 years

US Electricity Sales Decline amid population growth and GDP gains, as DOE links reduced per capita consumption to energy efficiency, warmer winters, appliances, and bulbs, while hotter summers and rising AC demand may offset savings.


Key Points

US electricity sales fell 3% since 2010 despite population and GDP growth, driven by efficiency gains and warmer winters.

✅ DOE links drops to efficiency and warmer winters

✅ Per capita residential use fell about 7% since 2010

✅ Rising AC demand may offset winter heating savings


Since 2010, the United States has grown by 17 million people, and the gross domestic product (GDP) has increased by $3.6 trillion. Yet in that same time span, electricity sales in the United States actually declined by 3%, according to data released by the U.S. Department of Energy (DOE), even as electricity prices rose at a 41-year pace nationwide.

The U.S. decline in electricity sales is remarkable given that the U.S. population increased by 5.8% in that same time span. This means that per capita electricity use fell even more than that; indeed, the Department of Energy pegs residential electricity sales per capita as having declined by 7%, even as inflation-adjusted residential bills rose 5% in 2022 nationwide.

There are likely multiple reasons for this decline in electricity sales. Department of Energy analysts suggest that, at least in part, it is due to increased adoption of energy-efficient appliances and bulbs, like compact fluorescents. Indeed, the DOE notes that there is a correlation between consumer spending on “energy efficiency” and a reduction in per capita electricity sales, while utilities invest more in delivery infrastructure to modernize the grid.

Yet the DOE also notes that states with a greater increase in warm weather days had a corresponding decrease in electricity sales, as milder weather can reduce power demand across years. In southern states, the effect was most dramatic: for instance, from 2010 to 2016, Florida had a 56% decrease in cold weather days that would require heating and as a result, saw a 9% decrease in per capita electricity sales.

The moral is that warm winters save on electricity. But if global temperatures continue to rise, and summers become hotter, too, this decrease in winter heating spending may be offset by the increased need to run air conditioning in the summer, and given how electricity and natural gas prices interact, overall energy costs could shift. Indeed, it takes far more energy to cool a room than it does to heat it, for reasons related to the basic laws of thermodynamics. 


Related News

View more

'Electricity out of essentially nothing': Invention creates power from falling snow

Snow-powered nanogenerator harvests static electricity from falling snow using a silicone triboelectric design, enabling energy harvesting, solar panel support during snowfall, and dual-use sensing for weather monitoring and wearable winter sports analytics.


Key Points

A silicone triboelectric device that harvests snowDcharge to generate power and enable sensing.

✅ Triboelectric silicone layer captures charge from falling snow.

✅ Integrates with solar arrays to maintain power during snowfall.

✅ Functions as weather and motion sensor for winter sports.


Scientists from University of California, Los Angeles and McMaster University have invented a nanogenerator that creates electricity from falling snow.

Most Canadians have already seen a mini-version of this, McMaster Prof. Ravi Selvaganapathy told CTV’s Your Morning. “We find that we often get shocked in the winter when it’s dry when we come in into contact with a conductive surface like a doorknob.”

The thin device works by harnessing static electricity: positively-charged, falling snow collides with the negatively-charged silicone device, which produces a charge that’s captured by an electrode.

“You separate the charges and create electricity out of essentially nothing,” Richard Kaner, who holds UCLA’s Dr. Myung Ki Hong Endowed Chair in Materials Innovation and whose lab has explored turning waste into graphene, said in a press release.

“The device can work in remote areas because it provides its own power and does not need batteries or reliance on home storage systems such as the Tesla Powerwall, which store energy for later use,” he said, explaining that the device was 3D printed, flexible and inexpensive to make because of the low cost of silicone.

“It’s also going to be useful in places like Canada, where we get a lot of snow and are pursuing a net-zero grid by 2050 to cut emissions. We can extract energy from the environment,” Selvaganapathy added.

The team, which also included scientists from the University of Toronto, published their findings in Nano Energy journal last year, but a few weeks ago, they revealed the device’s more practical uses.

About 30 per cent of the Earth’s surface is covered by snow each winter, which can significantly limit the energy generated by solar panels, including rooftop solar grids in cold climates.

So the team thought: why not simply harness electricity from the snow whenever the solar panels were covered?

Integrating their device into solar panel arrays could produce a continuous power supply whenever it snows, potentially as part of emerging virtual power plants that aggregate distributed resources, study co-author and UCLA assistant researcher Maher El-Kady explained.

The device also serves as a weather-monitoring station by recording how much snow is falling and from where; as well as the direction and speed of the wind.

The team said they also want to incorporate their device into weather sensors to help them better acquire and transmit electronic signals, supporting initiatives to use AI for energy savings across local grids. They said several Toronto-based companies -- which they couldn’t name -- have expressed interest in partnering with them.

Selvaganapathy said the device would hop on the trend of “sensors being incorporated into what we wear, into our homes and even to detect electricity theft in some markets in order to monitor a lot of the things that are important to us”

But the device’s arguably larger potential use is being integrated into technology to monitor athletes and their performances during winter sports, such as hiking, skiing and cross-country skiing.

Up to now, the movement patterns used during cross-country skiing couldn’t be detected by a smart watch, but this device may be able to.

Scientists such as Kaner believe the technology could usher in a new era of self-monitoring devices to assess an athlete’s performance while they’re running, walking or jumping.

The device is simply a proof of concept and the next step would be figuring out how to generate more electricity and integrate it into all of these potential devices, Selvaganapathy said.


Related News

View more

Windstorm Causes Significant Power Outages

Vancouver October 2024 Windstorm brought extreme weather to British Columbia, causing power outages, storm damage, and downed lines as BC Hydro crews led emergency response and restoration, highlighting climate change resilience and community preparedness.


Key Points

A severe storm with 100 km/h gusts that caused outages and damage in Vancouver, prompting wide power restoration.

✅ 100 km/h gusts toppled trees and downed power lines

✅ Over 200,000 BC Hydro customers lost electricity

✅ Crews and communities coordinated emergency response


In October 2024, a powerful windstorm swept through the Vancouver area, resulting in widespread power outages and disruption across the region. The storm, characterized by fierce winds and heavy rainfall, reflected conditions seen when strong winds in the Miami Valley knocked out power earlier this year, and was part of a larger weather pattern that affected much of British Columbia. Residents braced for the impacts, with local authorities and utility companies preparing for the worst.

The Storm's Impact

The windstorm hit Vancouver with wind gusts exceeding 100 km/h, toppling trees, and downing power lines. As the storm progressed, reports of damaged properties and fallen trees began to flood in. Many neighborhoods experienced significant power outages, mirroring widespread outages in Quebec earlier in the season, with thousands of residents left without electricity for extended periods. The areas hardest hit included the West End, Kitsilano, and parts of the North Shore, where the impact of the storm was particularly severe.

Utility companies, including BC Hydro operations, mobilized their crews quickly in response to the storm's aftermath. Emergency response teams worked tirelessly to restore power, often facing challenging conditions. The restoration efforts were complicated by the sheer number of outages reported—over 200,000 customers were affected at the height of the storm. Crews encountered not only downed lines but also hazardous conditions as they navigated through debris-laden streets.

Community Response and Resilience

In the wake of the storm, the community showcased remarkable resilience. Local residents rallied together to assist one another, sharing resources and providing support to those most affected. Many community centers opened their doors as emergency shelters, offering warmth and safety to those without power, a step also taken when a London power outage disrupted mornings for thousands across the city.

Authorities also emphasized the importance of preparedness in such situations. They urged residents to have emergency kits ready, including food, water, and essential supplies, noting that nearby areas like North Seattle can face sudden outages with little warning. Local officials highlighted the value of staying informed through weather updates and alerts, allowing residents to make informed decisions during extreme weather events.

The Role of Climate Change

The October windstorm serves as a stark reminder of the increasing frequency and intensity of extreme weather events, a trend often linked to climate change. Experts have noted that rising global temperatures are contributing to more severe weather patterns, including stronger storms and increased Toronto flooding events. As cities like Vancouver face the reality of climate change, discussions about infrastructure resilience and adaptation strategies have gained urgency.

City planners and environmental advocates are pushing for initiatives that enhance the city's ability to withstand extreme weather. This includes improving stormwater management systems, increasing green spaces to absorb rainfall, and investing in renewable energy sources. By addressing these challenges proactively, Vancouver aims to mitigate the impacts of future storms and protect its residents.

Moving Forward

As recovery efforts continue, the focus now shifts to restoring normalcy and preparing for future weather events. Residents are encouraged to report any ongoing outages or hazards to local authorities and to stay updated through reliable news sources. BC Hydro and other utility companies are committed to transparency, providing regular updates on power restoration efforts, even as outages can persist for days as seen in Toronto after a spring storm.

The October 2024 windstorm will be remembered not only for its immediate impacts but also as a catalyst for discussions on resilience and community preparedness. As Vancouver looks ahead, the lessons learned from this storm will shape strategies for better handling extreme weather, ensuring that the city is equipped to face the challenges posed by a changing climate.

In conclusion, while the windstorm caused significant disruption and hardship for many, it also highlighted the strength of community spirit and the importance of proactive planning in the face of climate challenges. Vancouver's response and recovery will be crucial in building a more resilient future for all its residents.


Related News

View more

Americans Keep Using Less and Less Electricity

U.S. Electricity Demand Decoupling signals GDP growth without higher load, driven by energy efficiency, LED adoption, services-led output, and rising renewables integration with the grid, plus EV charging and battery storage supporting decarbonization.


Key Points

GDP grows as electricity use stays flat, driven by efficiency, renewables, and a shift toward services and output.

✅ LEDs and codes cut residential and commercial load intensity.

✅ Wind, solar, and gas gain share as coal and nuclear struggle.

✅ EVs and storage can grow load and enable grid decarbonization.


By Justin Fox

Economic growth picked up a little in the U.S. in 2017. But electricity use fell, with electricity sales projections continuing to decline, according to data released recently by the Energy Information Administration. It's now been basically flat for more than a decade:


Measured on a per-capita basis, electricity use is in clear decline, and is already back to the levels of the mid-1990s.


Sources: U.S. Energy Information Administration, U.S. Bureau of Economic Analysis

*Includes small-scale solar generation from 2014 onward


I constructed these charts to go all the way back to 1949 in part because I can (that's how far back the EIA data series goes) but also because it makes clear what a momentous change this is. Electricity use rose and rose and rose and then ... it didn't anymore.

Slower economic growth since 2007 has been part of the reason, but the 2017 numbers make clear that higher gross domestic product no longer necessarily requires more electricity, although the Iron Law of Climate is often cited to suggest rising energy use with economic growth. I wrote a column last year about this big shift, and there's not a whole lot new to say about what's causing it: mainly increased energy efficiency (driven to a remarkable extent by the rise of LED light bulbs), and the continuing migration of economic activity away from making tangible things and toward providing services and virtual products such as games and binge-watchable TV series (that are themselves consumed on ever-more-energy-efficient electronic devices).

What's worth going over, though, is what this means for those in the business of generating electricity. The Donald Trump administration has made saving coal-fired electric plants a big priority; the struggles of nuclear power plants have sparked concern from multiple quarters. Meanwhile, U.S. natural gas production has grown by more than 40 percent since 2007, thanks to hydraulic fracturing and other new drilling techniques, while wind and solar generation keep making big gains in cost and market share. And this is all happening within the context of a no-growth electricity market.

In China, a mystery in China's electricity data has complicated global comparisons.


Here are the five main sources of electric power in the U.S.:


The big story over the past decade has been coal and natural gas trading places as the top fuel for electricity generation. Over the past year and a half coal regained some of that lost ground as natural gas prices rose from the lows of early 2016. But with overall electricity use flat and production from wind and solar on the rise, that hasn't translated into big increases in coal generation overall.

Oh, and about solar. It's only a major factor in a few states (California especially), so it doesn't make the top five. But it's definitely on the rise.


What happens next? For power generators, the best bet for breaking out of the current no-growth pattern is to electrify more of the U.S. economy, especially transportation. A big part of the attraction of electric cars and trucks for policy-makers and others is their potential to be emissions-free. But they're only really emissions-free if the electricity used to charge them is generated in an emissions-free manner -- creating a pretty strong business case for continuing "decarbonization" of the electric industry. It's conceivable that electric car batteries could even assist in that decarbonization by storing the intermittent power generated by wind and solar and delivering it back onto the grid when needed.

I don't know exactly how all this will play out. Nobody does. But the business of generating electricity isn't going back to its pre-2008 normal. 


Related News

View more

Energy Efficiency and Demand Response Can Nearly Level Southeast Electricity Demand for More than a Decade

Southeast Electricity Demand Forecast examines how energy efficiency, photovoltaics, electric vehicles, heat pumps, and demand response shape grid needs, stabilize load through 2030, shift peaks, and inform utility planning across the region.


Key Points

An outlook of load shaped by efficiency, solar, EVs, with demand response keeping usage steady through 2030.

✅ Stabilizes regional demand through 2030 under accelerated adoption

✅ Energy efficiency and demand response are primary levers

✅ EVs and heat pumps drive growth post 2030; shift winter peaks


Electricity markets in the Southeast are facing many changes on the customer side of the meter. In a new report released today, we look at how energy efficiency, photovoltaics (solar electricity), electric vehicles, heat pumps, and demand response (shifting loads from periods of high demand) might affect electricity needs in the Southeast.

We find that if all of these resources are pursued on an accelerated basis, electricity demand in the region can be stabilized until about 2030.

After that, demand will likely grow in the following decade because of increased market penetration of electric vehicles and heat pumps, but energy planners will have time to deal with this growth if these projections are borne out. We also find that energy efficiency and demand response can be vital for managing electricity supply and demand in the region and that these resources can help contain energy demand growth, reducing the impact of expensive new generation on consumer wallets.


National trends

This is the second ACEEE report looking at regional electricity demand. In 2016, we published a study on electricity consumption in New England, finding an even more pronounced effect. For New England, with even more aggressive pursuit of energy efficiency and these other resources, consumption was projected to decline through about 2030, before rebounding in the following decade.

These regional trends fit into a broader national pattern. In the United States, electricity consumption has been characterized by flat electricity demand for the past decade. Increased energy efficiency efforts have contributed to this lack of consumption growth, even as the US economy has grown since the Great Recession. Recently, the US Energy Information Administration (EIA – a branch of the US Department of Energy) released data on US electricity consumption in 2016, finding that 2016 consumption was 0.3% below 2015 consumption, and other analysts reported a 1% slide in 2023 on milder weather.


Five scenarios for the Southeast

ACEEE’s new study focuses on the Southeast because it is very different from New England, with warmer weather, more economic growth, and less-aggressive energy efficiency and distributed energy policies than the Northeast. For the Southeast, we examined five scenarios: a business-as-usual scenario; two alternative scenarios with progressively higher levels of energy efficiency, photovoltaics informed by a solar strategy for the South that is emerging regionally, electric vehicles, heat pumps, and demand response; and two scenarios combining high numbers of electric vehicles and heat pumps with more modest levels of the other resources. This figure presents electricity demand for each of these scenarios:

Over the 2016-2040 period, we project that average annual growth will range from 0.1% to 1.0%, depending on the scenario, much slower than historic growth in the region. Energy efficiency is generally the biggest contributor to changes in projected 2040 electricity consumption relative to the business-as-usual scenario, as shown in the figure below, which presents our accelerated scenario that is based on levels of energy efficiency and other resources now targeted by leading states and utilities in the Southeast.

To date, Entergy Arkansas has achieved the annual efficiency savings as a percent of sales shown in the accelerated scenario and Progress Energy (a division of Duke Energy) has nearly achieved those savings in both North and South Carolina. Sixteen states outside the Southeast have also achieved these savings statewide.

The efficiency savings shown in the aggressive scenario have been proposed by the Arkansas PSC. This level of savings has already been achieved by Arizona as well as six other states. Likewise, the demand response savings we model have been achieved by more than 10 utilities, including four in the Southeast. The levels of photovoltaic, electric vehicle, and heat pump penetration are more speculative and are subject to significant uncertainty.

We also examined trends in summer and winter peak demand. Most utilities in the Southeast have historically had peak demand in the summer, often seeing heatwave-driven surges that stress operations across the Eastern U.S., but our analysis shows that winter peaks will be more likely in the region as photovoltaics and demand response reduce summer peaks and heat pumps increase winter peaks.


Why it’s vital to plan broadly

Our analysis illustrates the importance of incorporating energy efficiency, demand response, and photovoltaics into utility planning forecasts as utility trends to watch continue to evolve. Failing to include these resources leads to much higher forecasts, resulting in excess utility system investments, unnecessarily increasing customer electricity rates. Our analysis also illustrates the importance of including electric vehicles and heat pumps in long-term forecasts. While these technologies will have moderate impacts over the next 10 years, they could become increasingly important in the long run.

We are entering a dynamic period of substantial uncertainty for long-term electricity sales and system peaks, highlighted by COVID-19 demand shifts that upended typical patterns. We need to carefully observe and analyze developments in energy efficiency, photovoltaics, electric vehicles, heat pumps, and demand response over the next few years. As these technologies advance, we can create policies to reduce energy bills, system costs, and harmful emissions, drawing on grid reliability strategies tested in Texas, while growing the Southeast’s economy. Resource planners should be sure to incorporate these emerging trends and policies into their long-term forecasts and planning.


Related News

View more

Illinois electric utility publishes online map of potential solar capacity

ComEd Hosting Capacity Map helps Illinois communities assess photovoltaic capacity, distributed energy resources, interconnection limits, and grid planning needs, guiding developers and policymakers on siting solar, net metering feasibility, and RPS-aligned deployment by circuit.


Key Points

An online tool showing circuit-level DER capacity, PV limits, and interconnection readiness across ComEd.

✅ Circuit-level estimates of solar hosting capacity

✅ Guides siting, interconnection, and net metering

✅ Supports RPS goals with grid planning insights


As the Illinois solar market grows from the Future Energy Jobs Act, the largest utility in the state has posted a planning tool to identify potential PV capacity in their service territory. ComEd, a Northern Illinois subsidiary of Exelon, has a hosting capacity website for its communities indicating how much photovoltaic capacity can be sited in given areas, based on the existing electrical infrastructure, as utilities pilot virtual power plant programs that leverage distributed resources.

According to ComEd’s description, “Hosting Capacity is an estimate of the amount of DER [distributed energy resources] that may be accommodated under current configurations at the overall circuit level without significant system upgrades to address adverse impacts to power quality or reliability.” This website will enable developers and local decision makers to estimate how much solar could be installed by township, sections and fractions of sections as small as ½ mile by ½ mile and to gauge EV charging impacts with NREL's projection tool for distribution planning. The map sections indicate potential capacity by AC kilowatts with a link to to ComEd’s recently upgraded Interconnection and Net Metering homepage.

The Hosting Map can provide insight into how much solar can be installed in which locations in order to help solar reach a significant portion of the Illinois Renewable Portfolio Standard (RPS) of 25% electricity from renewable sources by 2025, and to plan for transportation electrification as EV charging infrastructure scales across utility territories. For example, the 18 sections of Oak Park Township capacity range from 612 to 909 kW, and total 13,260 kW of photovoltaic power. That could potentially generate around 20 million kWh, and policy actions such as the CPUC-approved PG&E EV program illustrate how electrification initiatives may influence future demand. Oak Park, according to the PlanItGreen Report Card, a joint project of the Oak Park River Forest Community Foundation and Seven Generations Ahead, uses about 325 million kWh.

Based on ComEd’s Hosting Capacity, Oak Park could generate about 6% of its electricity from solar power located within its borders. Going significantly beyond this amount would likely require a combination of upgrades by ComEd’s infrastructure, potentially higher interconnection costs and deployment of technologies like energy storage solutions. What this does indicate is that a densely populated community like Oak Park would most likely have to get the majority of its solar and renewable electricity from outside its boundaries to reach the statewide RPS goal of 25%. The Hosting Capacity Map shows a considerable disparity among communities in ½ mile by ½ mile sections with some able to host only 100-200 kWs to some with capacities of over 3,000 kW.


Related News

View more

Sign Up for Electricity Forum’s Newsletter

Stay informed with our FREE Newsletter — get the latest news, breakthrough technologies, and expert insights, delivered straight to your inbox.

Electricity Today T&D Magazine Subscribe for FREE

Stay informed with the latest T&D policies and technologies.
  • Timely insights from industry experts
  • Practical solutions T&D engineers
  • Free access to every issue

Live Online & In-person Group Training

Advantages To Instructor-Led Training – Instructor-Led Course, Customized Training, Multiple Locations, Economical, CEU Credits, Course Discounts.

Request For Quotation

Whether you would prefer Live Online or In-Person instruction, our electrical training courses can be tailored to meet your company's specific requirements and delivered to your employees in one location or at various locations.