NFPA 70b Training - Electrical Maintenance
Our customized live online or in‑person group training can be delivered to your staff at your location.

- Live Online
- 12 hours Instructor-led
- Group Training Available
Regular Price:
$699
Coupon Price:
$599
NEW YORK
—
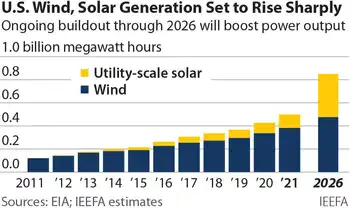
US Wind and Solar Outlook 2026 projects cheap renewables displacing coal and gas, with utility-scale additions, rooftop solar growth, improved grid reliability, and EV V2G integration accelerating decarbonization across the electricity market.
Top Insights
An analysis forecasting wind and solar growth, displacing coal and gas as utility-scale and rooftop solar expand.
Utility-scale solar installs avg 21 GW/yr through 2026.
37.7 GW wind in pipeline; 127.8 GW already online.
Small-scale solar could near 100 TWh in 2026.
A recent report from the Institute for Energy Economics and Financial Analysis (IEEFA) predicts that cheap renewables in the form of wind and solar will push coal and gas out of the energy market space. Already at 9% of US generation, the report predicts that wind and solar will supply almost 30% of US electricity demand by 2026, consistent with renewables nearing one-fourth of U.S. generation projections for the near term.
“The Solar Energy Industries Association now expects utility-scale installations to average more than 21,000MW a year through 2026, following a year when U.S. solar generation rose 25% and with a peak of 25,000MW in 2023,” IEEFA writes. “Continued growth is also expected in U.S. wind generation, mirroring global trends where China's solar PV expansion outpaced all other fuels in 2016, with 37.7GW of new capacity already under construction or in advanced development, which would be added to 127.8GW in existing installed capacity.”
Meanwhile, with wind and solar growth booming, fossil fuels are declining, as renewables surpassed coal in 2022 nationwide. “Coal and natural gas are now locked into an essentially zero-sum game where increases in one fuel’s generation comes at the expense of the other. Together, they are not gaining market share, rather they are trading it back and forth, and the rapid growth in renewable generation will cut even deeper into the market share of both.”
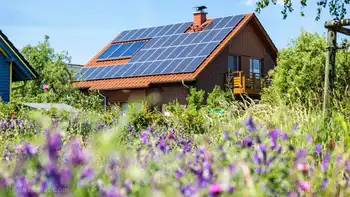
And what of rooftop solar? Some states in Australia now have periods where the entire state grid is powered just by solar on the roofs of private citizens. As this revolution progresses in the USA, especially if a tenfold national solar push moves forward, what impact will it make on fossil fuel generators — which are expensive to build, expensive to maintain, expensive to fuel, and rely on an expensive distribution network.
“EIA estimates that this ‘small-scale solar’ produced 41.7 million MWh of power in 2020, when solar accounted for about 3% of U.S. electricity, a 19 percent increase from 2019. This growth will likely continue in the years ahead as costs continue to fall and concerns about grid reliability rise. Assuming a conservative 15 percent annual increase in small-scale solar going forward would push the sector’s generation to almost 100 million MWh in 2026.”
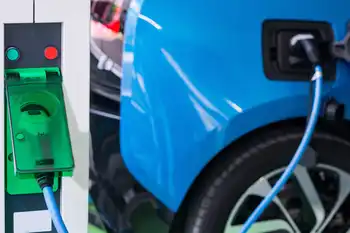
The Joker in the story might be the impact from electric vehicle adoption. Sales are set to surge and there’s more and more interest in V2G technology, even as wind and solar could provide 50% by 2050 in broader forecasts.
Related News
Related News
Peer-to-peer energy breakthrough could allow solar and wind energy sources to be shared
Microgrid solar outage algorithms optimize renewable energy during blackouts using grid-forming inverters, islanding control, demand…
View more
Electric vehicles can fight climate change, but they’re not a silver bullet: U of T study
EV Adoption Limits highlight that electric vehicles alone cannot meet emissions targets; life cycle assessment,…
View more
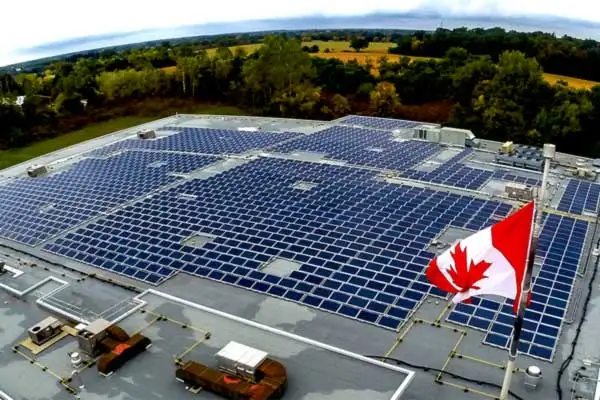
Canada is a solar power laggard, this expert says
Canada Distributed Energy faces disruption as solar, smart grids, microgrids, and storage scale utility-scale renewables,…
View more
The government's 2035 electric vehicle mandate is delusional
Canada 2035 Zero-Emission Vehicle Mandate sets EV sales targets, raising concerns over affordability, battery materials…
View more

NREL’s Electric Vehicle Infrastructure Projection Tool Helps Utilities, Agencies, and Researchers Predict Hour-by-Hour Impact of Charging on the Grid
EVI-Pro Lite EV Load Forecasting helps utilities model EV charging infrastructure, grid load shapes, and…
View more
Zero-emissions electricity by 2035 is possible
Canada Net-Zero Electricity 2035 aligns policy and investments with renewables, wind, solar, hydro, storage, and…
View more
Sign Up for Electricity Forum’s Newsletter
Stay informed with our FREE Newsletter — get the latest news, breakthrough technologies, and expert insights, delivered straight to your inbox.
Electricity Today T&D Magazine Subscribe for FREE

Stay informed with the latest T&D policies and technologies.
- Timely insights from industry experts
- Practical solutions T&D engineers
- Free access to every issue

