
Electrical Commissioning In Industrial Power Systems
Our customized live online or in‑person group training can be delivered to your staff at your location.

- Live Online
- 12 hours Instructor-led
- Group Training Available
Regular Price:
$599
Coupon Price:
$499
TOKYO
—
Olympus Renewable Energy Initiative reduces CO2 emissions by sourcing 100% clean electricity at major Japan R&D and manufacturing sites, accelerating ESG goals toward net zero, decarbonization, and TCFD-aligned sustainability across global operations.
Context and Background
Olympus's program to source renewable power, cut CO2, and reach net-zero site operations by 2030.
100% renewable electricity at major Japan R&D and manufacturing sites
Expected 70% renewable share of electricity in FY2023
Net-zero site operations targeted company-wide by 2030
Olympus Corporation announces that from April 2022, the company has begun to exclusively source 100% of the electricity used at its major R&D and manufacturing sites in Japan from renewable sources. As a result, CO2 emissions from Olympus Group facilities in Japan will be reduced by approximately 40,000 tons per year. The percentage of the Olympus Group's total electricity use in fiscal 2023 (ending March 2023) from renewable energy sources, including green hydrogen applications, is expected to substantially increase from approximately 14% in the previous fiscal year to approximately 70%.
Olympus has set a goal of achieving net zero CO2 emissions from its site operations by 2030, as part of its commitment to achieving environmentally responsible business growth and creating a sustainable society, aligning with Europe's push for electrification to address climate goals. This is a key goal in line with Olympus Corporation's ESG materiality targets focused on the theme of a "carbon neutral society and circular economy."
The company has already introduced a wide range of initiatives to reduce CO2 emissions. This includes the use of 100% renewable energy at some manufacturing sites in Europe, despite electricity price volatility in the region, and the United States, the installation of solar power generation facilities at some manufacturing sites in Japan, and support of the recommendations made by the Task Force on Climate-related Financial Disclosures (TCFD), alongside developments such as Honda's Ontario battery investment that signal rapid electrification.
To achieve its carbon neutral goal, Olympus will continue to optimize manufacturing processes and promote energy-saving measures, and notes that policy momentum from Canada's EV sales regulations and EPA emissions limits is accelerating complementary electrification trends, is committed to further accelerate the shift to renewable energy sources across the company, thereby contributing to the decarbonization of society on a global level, as reflected in regional labor markets like Ontario's EV jobs boom that accompany the transition.
Related News
Related News
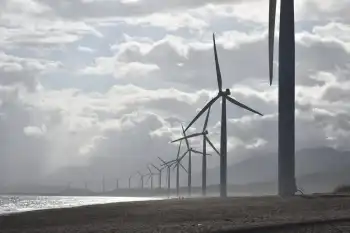
California and Oregon Coastal Communities Grapple With Offshore Wind
Coastal communities in California and Oregon are weighing the impacts and benefits of offshore wind…
View more
Factory Set to Elevate the United States in the Clean Energy Race
Maxeon IBC Solar Factory USA will scale clean energy with high-efficiency interdigitated back contact panels,…
View more
Peer-to-peer energy breakthrough could allow solar and wind energy sources to be shared
Microgrid solar outage algorithms optimize renewable energy during blackouts using grid-forming inverters, islanding control, demand…
View more

The Single Biggest Threat To The Electric Vehicle Boom
EV Boom Aftershock highlights electric vehicles straining grid capacity as policy accelerates adoption, requiring charging…
View more
"Remarkable" New Contract Award Adds 10 GW of Renewables to UK Grid
UK Renewable Energy Auction secures 10 GW for the grid at record-low costs, led by…
View more

Michigan solar supporters make new push to eliminate rooftop solar caps
Michigan Distributed Energy Cap Repeal advances a bipartisan bill to boost rooftop solar and net…
View more
Sign Up for Electricity Forum’s Newsletter
Stay informed with our FREE Newsletter — get the latest news, breakthrough technologies, and expert insights, delivered straight to your inbox.
Electricity Today T&D Magazine Subscribe for FREE

Stay informed with the latest T&D policies and technologies.
- Timely insights from industry experts
- Practical solutions T&D engineers
- Free access to every issue
