Ottawa to release promised EV sales regulations


ev charging

NFPA 70b Training - Electrical Maintenance

Our customized live online or in‑person group training can be delivered to your staff at your location.

  • Live Online
  • 12 hours Instructor-led
  • Group Training Available
Regular Price:
$599
Coupon Price:
$499
Reserve Your Seat Today

Canada ZEV Availability Standard sets EV sales targets and zero-emission mandates, using compliance credits, early credits, and charging infrastructure investments under CEPA to accelerate affordable ZEV supply and meet 2035 net-zero goals.


Key Points

A federal ZEV policy setting 2026-2035 sales targets, using tradable credits and infrastructure incentives under CEPA.

✅ Applies to automakers; compliance via tradable ZEV credits under CEPA.

✅ Targets: 20% by 2026, 60% by 2030, 100% by 2035.

✅ Early credits up to 10% for 2026; charging investments earn credits.


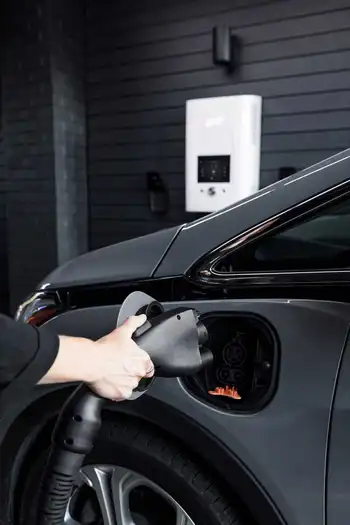
Canadian Automobile manufacturers are on the brink of significant changes as Ottawa prepares to introduce its long-awaited electric vehicle regulations. A reliable source within the government says final regulations are aimed at ensuring that all new passenger vehicles sold in Canada by 2035 are zero-emission vehicles, a goal some critics question through analyses of the 2035 EV mandate in Canada.

These regulations, known as the Electric Vehicle Availability Standard, are designed to encourage automakers to produce more affordable zero-emission vehicles to meet the increasing demand. One of the key concerns for Canada is the potential dominance of zero-emission vehicle supply by other countries, particularly the United States, where several states have already implemented sales targets for such vehicles, and new EPA emission limits are expected to boost EV sales nationwide as well.

It's important to note that these regulations will apply primarily to automakers, rather than dealerships. Under this legislation, manufacturers will be required to accumulate sufficient credits to demonstrate their compliance with the established targets.

Automakers will be able to earn credits based on their sales of low- and no-emissions vehicles. The number of credits earned will depend on how close these vehicles come to meeting a zero-emissions standard. Additionally, manufacturers could earn early credits, amounting to a maximum of 10 percent of their total compliance requirements for 2026, by introducing more electric vehicles to the market ahead of schedule, even amid recent EV shortages and wait times reported across Canada.

Automakers can also increase their credit balance by contributing to the development of electric vehicle charging infrastructure, recognizing that fossil fuels still powered part of Canada's grid in 2019 and that charging availability remains a key enabler. In cases where companies exceed or fall short of their compliance targets, they will have the option to buy or sell credits to other manufacturers or use previously accumulated credits.

Further details regarding these regulations, which will be enacted under the Canadian Environmental Protection Act, are set to be unveiled soon and will intersect with provincial approaches such as Quebec's, where experts have questioned the push for EV dominance as policies evolve.

These regulations will become effective starting with the model year 2026, and sales targets will progressively rise each year until 2035. The federal government's ambitious EV goals are to have 20 percent of all vehicles sold in Canada be zero-emission vehicles by 2026, with that figure increasing to 60 percent by 2030 and reaching 100 percent by 2035.

According to a government analysis conducted in 2022, the anticipated total cost to consumers for zero-emission vehicles and chargers over 25 years is estimated at $24.5 billion, though cost remains a primary barrier for many Canadians considering an EV. However, it is projected that Canadians will save approximately $33.9 billion in net energy costs over the same period. Please note that these estimates are part of a draft and may be subject to change upon the government's release of its final analysis.

In terms of environmental impact, these regulations are expected to prevent the release of an estimated 430 million tonnes of greenhouse gas emissions, according to regulatory analysis. Environmental Defence, a Canadian environmental think-tank, has estimated that the policy would also result in a substantial reduction in gasoline consumption, equivalent to filling approximately 73,000 Olympic-sized swimming pools with gasoline.

Nate Wallace, the program manager for clean transportation at Environmental Defence, emphasized the significance of these regulations, stating, "2035 really needs to be the last year that we are selling gasoline cars in Canada brand new if we're going to have any chance of actually, by 2050, reaching net-zero carbon emissions."


Related News

Related News

Should California accelerate its 100% carbon-free electricity mandate?

California 100% Clean Energy by 2030 proposes accelerating SB 100 with solar, wind, offshore wind, and battery storage to decarbonize the grid, enhance reliability, and reduce blackouts, leveraging transmission upgrades and long-duration storage solutions.


Key Points

Proposal to accelerate SB 100 to 2030, delivering a carbon-free grid via renewables, storage, and new transmission.

✅ Accelerates SB 100 to a 2030 carbon-free electricity target

✅ Scales solar, wind, offshore wind, and battery storage capacity

✅ Requires transmission build-out and demand response for reliability


Amid a spate of wildfires that have covered large portions of California with unhealthy air, an environmental group that frequently lobbies the Legislature in Sacramento is calling on the state to accelerate by 15 years California's commitment to derive 100 percent of its electricity from carbon-free sources.

But skeptics point to last month's pair of rolling blackouts and say moving up the mandate would be too risky.

"Once again, California is experiencing some of the worst that climate change has to offer, whether it's horrendous air quality, whether it's wildfires, whether it's scorching heat," said Dan Jacobson, state director of Environment California. "This should not be the new normal and we shouldn't allow this to become normal."

Signed by then-Gov. Jerry Brown in 2018, Senate Bill 100 commits California by 2045 to use only sources of energy that produce no greenhouse gas emissions to power the electric grid, a target that echoes Minnesota's 2050 carbon-free plan now under consideration.

Implemented through the state's Renewable Portfolio Standard, SB 100 mandates 60 percent of the state's power will come from renewable sources such as solar and wind within the next 10 years. By 2045, the remaining 40 percent can come from other zero-carbon sources, such as large hydroelectric dams, a strategy aligned with Canada's electricity decarbonization efforts toward climate pledges.

SB 100 also requires three state agencies _ the California Energy Commission, the California Public Utilities Commission and the California Air Resources Board _ to send a report to the Legislature reviewing various aspects of the legislation.

The topics include scenarios in which SB 100's requirements can be accelerated. Following an Energy Commission workshop earlier this month, Environment California sent a six-page note to all three agencies urging a 100 percent clean energy standard by 2030.

The group pointed to comments by Gov. Gavin Newsom after he toured the devastation in Butte County caused by the North Complex fire.

"Across the entire spectrum, our (state) goals are inadequate to the reality we are experiencing," Newsom said Sept. 11 at the Oroville State Recreation Area.

Newsom "wants to look at his climate policies and see what he can accelerate," Jacobson said. "And we want to encourage him to take a look at going to 100 percent by 2030."

Jacobson said Newsom cam change the policy by issuing an executive order but "it would probably take some legislative action" to codify it.

However, Assemblyman Jim Cooper, a Democrat from the Sacramento suburb of Elk Grove, is not on board.

"I think someday we're going to be there but we can't move to all renewable sources right now," Cooper said. "It doesn't work. We've got all these burned-out areas that depend upon electricity. How is that working out? They don't have it."

In mid-August, California experienced statewide rolling blackouts for the first time since 2001.

The California Independent System Operator _ which manages the electric grid for about 80 percent of the state _ ordered utilities to ratchet back power, fearing the grid did not have enough supply to match a surge in demand as people cranked up their air conditioners during a stubborn heat wave that lingered over the West.

The outages affected about 400,000 California homes and businesses for more than an hour on Aug. 14 and 200,000 customers for about 20 minutes on Aug. 15.

The grid operator, known as the CAISO for short, avoided two additional days of blackouts in August and two more in September thanks to household utility customers and large energy users scaling back demand.

CAISO Chief Executive Officer Steve Berberich said the outages were not due to renewable energy sources in California's power mix. "This was a matter of running out of capacity to serve load" across all hours, Berberich told the Los Angeles Times.

California has plenty of renewable resources _ especially solar power _ during the day. The challenge comes when solar production rapidly declines as the sun goes down, especially between 7 p.m. and 8 p.m. in what grid operators call the "net load peak."

The loss of those megawatts of generation has to be replaced by other sources. And in an electric grid, system operators have to balance supply and demand instantaneously, generating every kilowatt that is demanded by customers who expect their lighting/heating/air conditioning to come on the moment they flip a switch.

Two weeks after the rotating outages, the State Water Resources Control Board voted to extend the lives of four natural gas plants in the Los Angeles area. Natural gas accounts for the largest single source of California's power mix _ 34.23 percent. But natural gas is a fossil fuel, not a carbon-free resource.

Jacobson said moving the mandate to 2030 can be achieved by more rapid deployment of renewable sources across the state.

The Public Utilities Commission has already directed power companies to ramp up capacity for energy storage, such as lithium-ion batteries that can be used when solar production falls off.

Long-term storage is another option. That includes pumped hydro projects in which hydroelectric facilities pump water from one reservoir up to another and then release it. The ensuing rush of water generates electricity when the grid needs it.

Environment California also pointed to offshore wind projects along the coast of Central and Northern California that it estimates could generate as much as 3 gigawatts of power by 2030 and 10 gigawatts by 2040. Offshore wind supporters say its potential is much greater than land-based wind farms because ocean breezes are stronger and steadier.

Gary Ackerman, a utilities and energy consultant with more than four decades of experience in power issues affecting states in the West, said the 2045 mandate was "an unwise policy to begin with" and to accommodate a "swift transition (to 2030), you're going to put the entire grid and everybody in it at risk."

But Ackerman's larger concern is whether enough transmission lines can be constructed in California to bring the electricity where it needs to go.

"I believe Californians consider transmission lines in their backyard about the same way they think about low-income housing _ it's great to have, but not in my backyard," Ackerman said. "The state is not prepared to build the infrastructure that will allow this grandiose build-out."

Cooper said he worries about how much it will cost the average utility customer, especially low and middle-income households. The average retail price for electricity in California is 16.58 cents per kilowatt-hour, compared to 10.53 nationally, according to the U.S. Energy Information Administration.

"What's sad is, we've had 110-degree days and there are people up here in the Central Valley that never turned their air conditioners on because they can't afford that bill," Cooper said.

Jacobson said the utilities commission can intervene if costs get too high. He also pointed to a recent study from the Goldman School of Public Policy at UC Berkeley that predicted the U.S. can deliver 90 percent clean, carbon-free electric grid by 2035 that is reliable and at no extra cost in consumers' bills.

"Every time we wait and say, 'Oh, what about the cost? Is it going to be too expensive?' we're just making the cost unbearable for our kids and grandkids," Jacobson said. "They're the ones who are going to pay the billions of dollars for all the remediation that has to happen ... What's it going to cost if we do nothing, or don't go fast enough?"

The joint agency report on SB 100 from the Energy Commission, the Public Utilities Commission and the Air Resources Board is due at the beginning of next year.


Related News

View more

Renewables became the second-most prevalent U.S. electricity source in 2020

2020 U.S. Renewable Electricity Generation set a record as wind, solar, hydro, biomass, and geothermal produced 834 billion kWh, surpassing coal and nuclear, second only to natural gas in nationwide power output.


Key Points

The record year when renewables made 834 billion kWh, topping coal and nuclear in U.S. electricity.

✅ Renewables supplied 21% of U.S. electricity in 2020

✅ Coal output fell 20% y/y; nuclear slipped 2% on retirements

✅ EIA forecasts renewables rise in 2021-2022; coal rebounds


In 2020, renewable energy sources (including wind, hydroelectric, solar, biomass, and geothermal energy) generated a record 834 billion kilowatthours (kWh) of electricity, or about 21% of all the electricity generated in the United States. Only natural gas (1,617 billion kWh) produced more electricity than renewables in the United States in 2020. Renewables surpassed both nuclear (790 billion kWh) and coal (774 billion kWh) for the first time on record. This outcome in 2020 was due mostly to significantly less coal use in U.S. electricity generation and steadily increased use of wind and solar generation over time, amid declining consumption trends nationwide.

In 2020, U.S. electricity generation from coal in all sectors declined 20% from 2019, while renewables, including small-scale solar, increased 9%. Wind, currently the most prevalent source of renewable electricity in the United States, grew 14% in 2020 from 2019, and the EIA expects solar and wind to be larger sources in summer 2022, reflecting continued growth. Utility-scale solar generation (from projects greater than 1 megawatt) increased 26%, and small-scale solar, such as grid-connected rooftop solar panels, increased 19%, while early 2021 January power generation jumped year over year.

Coal-fired electricity generation in the United States peaked at 2,016 billion kWh in 2007 and much of that capacity has been replaced by or converted to natural gas-fired generation since then. Coal was the largest source of electricity in the United States until 2016, and 2020 was the first year that more electricity was generated by renewables and by nuclear power than by coal (according to our data series that dates back to 1949). Nuclear electric power declined 2% from 2019 to 2020 because several nuclear power plants retired and other nuclear plants experienced slightly more maintenance-related outages.

We expect coal-fired generation to increase in the United States during 2021 as natural gas prices continue to rise and as coal becomes more economically competitive. Based on forecasts in our Short-Term Energy Outlook (STEO), we expect coal-fired electricity generation in all sectors in 2021 to increase 18% from 2020 levels before falling 2% in 2022. We expect U.S. renewable generation across all sectors to increase 7% in 2021 and 10% in 2022, and in 2021, non-fossil fuel sources accounted for about 40% of U.S. electricity. As a result, we forecast coal will be the second-most prevalent electricity source in 2021, and renewables will be the second-most prevalent source in 2022. We expect nuclear electric power to decline 2% in 2021 and 3% in 2022 as operators retire several generators.


Related News

View more

Toronto to start trial run of 'driverless' electric vehicle shuttles

Toronto Olli 2.0 Self-Driving Shuttle connects West Rouge to Rouge Hill GO with autonomous micro-transit. Electric shuttle pilot by Local Motors and Pacific Western Transportation, funded by Transport Canada, features accessibility, TTC and Metrolinx support.


Key Points

An autonomous micro-transit pilot linking West Rouge to Rouge Hill GO, with accessibility and onboard staff.

✅ Last-mile link: West Rouge to Rouge Hill GO

✅ Accessible: ramp, wheelchair securement, A/V announcements

✅ Operated with attendants; funded by Transport Canada


The city of Toronto, which recently opened an EV education centre to support adoption, has approved the use of a small, self-driving electric shuttle vehicle that will connect its West Rouge neighbourhood to the Rouge Hill GO station, a short span of a few kilometres.

It’s called the Olli 2.0, and it’s a micro-shuttle with service provided by Local Motors, in partnership with Pacific Western Transportation, as the province makes it easier to build EV charging stations to support growing demand.

The vehicle is designed to hold only eight people, and has an accessibility ramp, a wheelchair securement system, audio and visual announcements, and other features for providing rider information, aligning with transit safety policies such as the TTC’s winter lithium-ion device restrictions across the system.

“We are continuing to move our city forward on many fronts including micro-transit as we manage the effects of COVID-19,” said Mayor John Tory. “This innovative project will provide valuable insight, while embracing innovation that could help us build a better, more sustainable and equitable transportation network.”

At the provincial level, the public EV charging network has faced delays, underscoring infrastructure challenges.


Although the vehicle is “self-driving,” it will still require two people onboard for every trip during the six- to 12-month trial; those people will be a certified operator from Pacific Western Transportation, and either a TTC ambassador from an agency introducing battery electric buses across its fleet, or a Metrolinx customer service ambassador.

Funding for the program comes from Transport Canada, as part of a ten-year pilot program to test automated vehicles on Ontario’s roads that was approved in 2016, and it complements lessons from the TTC’s largest battery-electric bus fleet as well as emerging vehicle-to-grid programs that engage EV owners.


Related News

View more

California introduces new net metering regime

California NEM-3 Tariff ushers a successor Net Energy Metering framework, revising export compensation, TOU rates, and non-bypassable charges to balance ratepayer impacts, rooftop solar growth, and energy storage adoption across diverse communities.


Key Points

The CPUC's successor NEM policy redefining export credits and rates to sustain customer-sited solar and storage.

✅ Sets export compensation methodology beyond NEM 2.0

✅ Aligns TOU rates and non-bypassable charges with costs

✅ Encourages solar-plus-storage adoption and equity access


The California Public Utilities Commission (CPUC) has officially commenced its “NEM-3” proceeding, which will establish the successor Net Energy Metering (NEM) tariff to the “NEM 2.0” program in California. This is a highly anticipated, high-stakes proceeding that will effectively modify the rules for the NEM tariff in California, amid ongoing electricity pricing changes that affect residential rooftop solar – arguably the single most important policy mechanism for customer-sited solar over the last decade.

The CPUC’s recent order instituting rule-making (OIR) filing stated that “the major focus of this proceeding will be on the development of a successor to existing NEM 2.0 tariffs. This successor will be a mechanism for providing customer-generators with credit or compensation for electricity generated by their renewable facilities that a) balances the costs and benefits of the renewable electrical generation facility and b) allows customer-sited renewable generation to grow sustainably among different types of customers and throughout California’s diverse communities.”

This successor tariff proceeding was initiated by Assembly Bill 327, which was signed into law in October of 2013. AB 327 is best known as the legislation that directed the CPUC to create the “NEM 2.0” successor tariff, which was adopted by the CPUC in January of 2016.

The original Net Energy Metering program in California (“NEM 1.0”) effectively enabled full-retail value net metering “allowing NEM customers to be compensated for the electricity generated by an eligible customer-sited renewable resource and fed back to the utility over an entire billing period.” Under the NEM 2.0 tariff, customers were required to pay charges that aligned them more closely with non-NEM customer costs than under the original structure. The main changes adopted when the NEM 2.0 was implemented were that NEM 2.0 customer-generators must: (i) pay a one-time interconnection fee; (ii) pay non-bypassable charges on each kilowatt-hour of electricity they consume from the grid; and (iii) customers were required to transfer to a time-of-use (TOU) rate, with potential changes to electric bills for many customers.

NEM 2.0

The commencement of the NEM-3 OIR was preceded by the publishing of a 318-page Net Energy Metering 2.0 Lookback Study, which was published by Itron, Verdant Associates, and Energy and Environmental Economics. The CPUC-commissioned study had been widely anticipated and was expected to act as the starting reference point for the successor tariff proceeding. Verdant also hosted a webinar, which summarized the study’s inputs, assumptions, draft findings and results.

The study utilized several different tests to study the impact of NEM 2.0. The cost effectiveness analysis tests, which estimate costs and benefits attributed to NEM 2.0 include: (i) total resource cost test, (ii) participant cost test, (iii) ratepayer impact measure test, and (iv) program administrator test. The evaluation also included a cost of service analysis, which estimates the marginal cost borne by the utility to serve a NEM 2.0 customer.

The opening paragraph of the report’s executive summary stated that “overall, we found that NEM 2.0 participants benefit from the structure, while ratepayers see increased rates.” In every test that the author’s conducted the results generally supported this conclusion for residential customers. There were some exceptions in their findings. For example, in the cost of service analysis the report stated that “residential customers that install customer-sited renewable resources on average pay lower bills than the utility’s cost to serve them. On the other hand, nonresidential customers pay bills that are slightly higher than their cost of service after installing customer-sited renewable resources. This is largely due to nonresidential customer rates having demand charges (and other fixed fees), and the lower ratio of PV system size to customer load when compared to residential customers.”

Similar debates over solar rate design, including Massachusetts solar demand charges, highlight how demand charges and TOU decisions can affect customer economics.

NEM-3 timeline

Popular content
The preliminary schedule that the CPUC laid out in its OIR estimates that the proceeding will take roughly 15 months in total, starting with a November 2020 pre-hearing conference.

The real meat of the proceeding, where parties will present their proposals for what they believe the successor tariff should be, as the state considers revamping electricity rates to clean the grid, and really show their hand will not begin until the Spring of 2021. So we’re still a little ways away from seeing the proposals that the key parties to this proceeding, like the Investor Owned Utilities (PG&E, SCE, SDG&E), solar and storage advocates such as SEIA, CALSSA, Vote Solar, and ratepayer advocates like TURN) will submit.

While the outcome for the new successor NEM tariff is anyone’s guess at this point, some industry policy folks are starting to speculate. We think it is safe to assume that the value of exported energy will get reduced, with debates over income-based utility charges also influencing rate design. How much and the mechanism for how exports get valued remains to be seen. Based on the findings from the lookback study, it seems like the reduction in export value will be more severe than what happened when NEM 2.0 got implemented. In NEM 2.0, non-bypassable charges, which are volumetric charges that must be paid on all imported energy and cannot be netted-out by exports, only equated to roughly $0.02 to $0.03/kWh.

Given that the value of exports will almost certainly get reduced, we expect that to be bullish for energy storage as America goes electric and load shapes evolve. Energy storage attachment rates with solar are already steadily rising in California. By the time NEM-3 starts getting implemented, likely in 2022, we think storage attachment rates will likely escalate further.

We would not be surprised to see future storage attachment rates in California look like the Hawaiian market today, which are upwards of 80% for certain types of customers and applications. Two big questions on our mind are: (i) will the NEM 3.0 rules be different for different customer class: residential, CARE (e.g., low-income or disadvantaged communities), and commercial & industrial; (ii) will the CPUC introduce some sort of glidepath or phased in implementation approach?

The outcome of this proceeding will have far reaching implications on the future of customer-sited solar and energy storage in California. The NEM-3 outcome in California may likely serve as precedent for other states, as California exports its energy policies across the West, and utility territories that are expected to redesign their Net Energy Metering tariffs in the coming years.


Related News

View more

Solar produced 4.7% of U.S. electricity in 2022, generation up 25%

US Solar Electricity Generation 2022 rose to a 4.7% share, with 202,256 GWh, per EIA Electric Power Monthly; driven by PV capacity additions despite import constraints, alongside renewables trends in wind, nuclear, and hydroelectric output.


Key Points

The share and output of US solar PV in 2022: 4.7% of electricity and 202,256 GWh, as reported by the EIA.

✅ Solar PV reached 4.7% of US power; 202,256 GWh generated in 2022.

✅ Monthly share varied from about 3% in Jan to just over 6% in Apr.

✅ Wind was 10.1%; wind+solar hit slightly over 20% in April.


In 2022, solar photovoltaics made up 4.7% of U.S. electricity generation, an increase of almost 21% over the 2021 total when solar produced 3.9% of US electricity and about 3% in 2020 according to long-term outlooks. Total solar generation was up 25%, breaking through 200,000 GWh for the year.

The record deployment volumes of 2020 when renewables became the second-most U.S. electricity source and 2021 are the main factors behind this increase. If it were not for ongoing solar panel import difficulties and general inflation, solar’s contribution to electricity generation might have reached 5% in 2022. The data was released by the Department of Energy’s Energy Information Administration (EIA) in their Electric Power Monthly. This release includes data from December 2022, as well as the rest of the data from 2022.

Solar as a percentage of monthly electricity generation ranged from a low of almost 3% in January, to just over 6% in April. April’s production marked a new monthly record for solar generation in the US and coincided with a renewables share record that month.

Total generation of solar electricity peaked in July, at 21,708 GWh. Over the course of the year, solar production reached  202,256 GWh, and total U.S. electricity generation reached 4,303,980 GWh, a year in which renewables surpassed coal in the power mix overall. Total US electricity generation increased by 3.5% over the 4,157,467 GWh produced in 2021.

In 2022, wind energy contributed 10.1% of the total electricity generated in the United States. Wind and solar together produced 14.8% of U.S. electricity in 2022, growing from the 13% recorded in 2021. In April, when solar power peaked at just over 6%, wind and solar power together reached a peak of slightly over 20%, as a wind-and-solar milestone versus nuclear was noted that month, a new monthly record for the two energy sources.

In total, emissions free energy sources such as wind, solar photovoltaic and thermal, nuclear, hydroelectric, and geothermal, accounted for 37.9% of the total electricity generated in the U.S., while renewables provided about 25.5% share of the mix during the year. This value is barely higher than 2020’s 37.7% – but represents a return to growth after 2021 saw a decrease in emission free electricity to 37%.

Nuclear power was the most significant contributor to emission free electricity, making up a bit more than 45% of the total emissions free electricity. Wind energy ranked second at 26%, followed by hydroelectricity at 15%, and solar photovoltaic at 12%, confirming solar as the #3 renewable in the U.S. mix.

Emissions free electricity is a different summation than the EIA’s ‘Renewable Energy’ category. The Renewable Energy category also includes:

  • Wood and Wood-Derived Fuels
  • Landfill Gas
  • Biogenic Municipal Solid Waste
  • Other Waste Biomass

Nuclear produced 17.9% of the total U.S. electricity, a value that has generally stayed flat over the years. However, since nuclear facilities are being retired faster than new facilities are coming online, nuclear production has fallen in the past two years. After multiple long delays, we will probably see reactor three of the Vogtle nuclear facility come online in 2023. Reactor four is officially scheduled to come online later this year.

Hydroelectric production also declined in 2022, due to drought conditions in the southwestern United States. With rain and snow storms in California and the southwest, hydroelectricity generation may rebound in 2023.


Related News

View more

4 European nations to build North Sea wind farms

North Sea Offshore Wind Farms will deliver 150 GW by 2050 as EU partners scale renewable energy, offshore turbines, grid interconnectors, and REPowerEU goals to cut emissions, boost energy security, and reduce Russian fossil dependence.


Key Points

A joint EU initiative to build 150 GW of offshore wind by 2050, advancing REPowerEU, decarbonization, and energy security.

✅ Targets at least 150 GW of offshore wind by 2050

✅ Backed by Belgium, Netherlands, Germany, and Denmark

✅ Aligns with REPowerEU, grid integration, and emissions cuts


Four European Union countries plan to build North Sea wind farms capable of producing at least 150 gigawatts of energy by 2050 to help cut carbon emissions that cause climate change, with EU wind and solar surpassing gas last year, Danish media have reported.

Under the plan, wind turbines would be raised off the coasts of Belgium, the Netherlands, Germany and Denmark, where a recent green power record highlighted strong winds, daily Danish newspaper Jyllands-Posten said.

The project would mean a tenfold increase in the EU's current offshore wind capacity, underscoring how renewables are crowding out gas across Europe today.

“The North Sea can do a lot," Danish Prime Minister Frederiksen told the newspaper, adding the close cooperation between the four EU nations "must start now.”

European Commission President Ursula von der Leyen, German Chancellor Olaf Scholz, Dutch Prime Minister Mark Rutte and Belgian Prime Minister Alexander De Croo are scheduled to attend a North Sea Summit on Wednesday in Esbjerg, 260 kilometers (162 miles) west of Copenhagen.

In Brussels, the European Commission moved Wednesday to jump-start plans for the whole 27-nation EU to abandon Russian energy amid the Kremlin’s war in Ukraine. The commission proposed a nearly 300 billion-euro ($315 billion) package that includes more efficient use of fuels and a faster rollout of renewable power, even as stunted hydro and nuclear output may hobble recovery efforts.

The investment initiative by the EU's executive arm is meant to help the bloc start weaning themselves off Russian fossil fuels this year, even as Europe is losing nuclear power during the transition. The goal is to deprive Russia, the EU’s main supplier of oil, natural gas and coal, of tens of billions in revenue and strengthen EU climate policies.

“We are taking our ambition to yet another level to make sure that we become independent from Russian fossil fuels as quickly as possible,” von der Leyen said in Brussels when announcing the package, dubbed REPowerEU.

The EU has pledged to reduce carbon dioxide emissions by 55% compared with 1990 levels by 2030, and to get to net zero emissions by 2050, with a recent German renewables milestone underscoring the pace of change.

The European Commission has set an overall target of generating 300 gigawatts of offshore energy of by 2050, though grid expansion challenges in Germany highlight hurdles.

Along with climate change, the war in Ukraine has made EU nations eager to reduce their dependency on Russian natural gas and oil. In 2021, the EU imported roughly 40% of its gas and 25% of its oil from Russia.

At a March 11 summit, EU leaders agreed in principle to phase out Russian gas, oil and coal imports by 2027.


Related News

View more

Sign Up for Electricity Forum’s Newsletter

Stay informed with our FREE Newsletter — get the latest news, breakthrough technologies, and expert insights, delivered straight to your inbox.

Electricity Today T&D Magazine Subscribe for FREE

Stay informed with the latest T&D policies and technologies.
  • Timely insights from industry experts
  • Practical solutions T&D engineers
  • Free access to every issue

Download the 2025 Electrical Training Catalog

Explore 50+ live, expert-led electrical training courses –

  • Interactive
  • Flexible
  • CEU-cerified