CSA Z463 Electrical Maintenance -
Our customized live online or in‑person group training can be delivered to your staff at your location.

- Live Online
- 6 hours Instructor-led
- Group Training Available
Regular Price:
$249
Coupon Price:
$199
ODESA
—
Ukraine Wind Energy Resilience shields the grid with wind power along the Black Sea, dispersing turbines to withstand missile attacks, accelerate clean energy transition, aid EU integration, and strengthen energy security and rapid recovery.
Story Summary
A strategy in Ukraine using wind farms to harden the grid, ensure clean power, and speed recovery from missile strikes.
Distributed turbines reduce single-point-of-failure risk
Faster repair of substations and lines than power plants
Supports EU-aligned clean energy and grid security goals
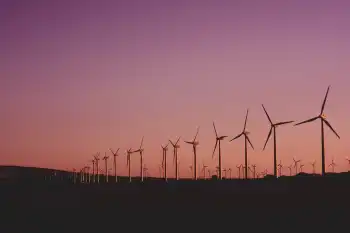
The giants catch the wind with their huge arms, helping to keep the lights on in Ukraine — newly built windmills, on plains along the Black Sea.
In 15 months of war, Russia has launched countless missiles and exploding drones at power plants, hydroelectric dams and substations, trying to black out as much of Ukraine as it can, as often as it can, even amid talk of limiting attacks on energy sites that has surfaced, in its campaign to pound the country into submission.
The new Tyligulska wind farm stands only a few dozen miles from Russian artillery, but Ukrainians say it has a crucial advantage over most of the country’s grid, helping stabilize the system even as electricity exports have occasionally resumed under fire.
A single, well-placed missile can damage a power plant severely enough to take it out of action, but Ukrainian officials say that doing the same to a set of windmills — each one tens of meters apart from any other — would require dozens of missiles. A wind farm can be temporarily disabled by striking a transformer substation or transmission lines, but these are much easier to repair than power plants.
“It is our response to Russians,” said Maksym Timchenko, CEO of DTEK Group, the company that built the turbines in the southern Mykolaiv region — the first phase of what is planned as Eastern Europe’s largest wind farm. “It is the most profitable and, as we know now, most secure form of energy.”
Ukraine has had laws in place since 2014 to promote a transition to renewable energy, both to lower dependence on Russian energy imports, with periods when electricity exports resumed to neighbors, and because it was profitable. But that transition still has a long way to go, and the war makes its prospects, like everything else about Ukraine’s future, murky.
In 2020, 12% of Ukraine’s electricity came from renewable sources — barely half the percentage for the European Union. Plans for the Tyligulska project call for 85 turbines producing up to 500 megawatts of electricity. That’s enough for 500,000 apartments — an impressive output for a wind farm, but less than 1% of the country’s prewar generating capacity.
After the Kremlin began its full-scale invasion of Ukraine in February 2022, the need for new power sources became acute, prompting deliveries such as a mobile gas turbine power plant to bolster capacity. Russia has bombarded Ukraine’s power plants and cut off delivery of the natural gas that fueled some of them.
Russian occupation forces have seized a large part of the country’s power supply, and Russia has built power lines to reactivate the Zaporizhzhia plant in occupied territory, ensuring that its output does not reach territory still held by Ukraine. They hold the single largest generator, the 5,700-megawatt Zaporizhzhia Nuclear Power Plant, which has been damaged repeatedly in fighting and has stopped transmitting energy to the grid, with UN inspectors warning of mines at the site during recent visits. They also control 90% of Ukraine’s renewable energy plants, which are concentrated in the southeast.
The postwar recovery plans Ukraine has presented to supporters including the European Union, which it hopes to join, feature a major new commitment to clean energy, even as a controversial proposal on Ukraine’s nuclear plants continues to stir debate.
Related News
Related News

California Solar and Battery Electricity Displacing Nat Gas Generation
California’s rise in solar and battery electricity is cutting into natural gas generation, with utilities…
View more

Climate change, not renewables, threaten grid
New Mexico Energy Transition Act advances renewable energy, battery storage, energy efficiency, and demand response…
View more

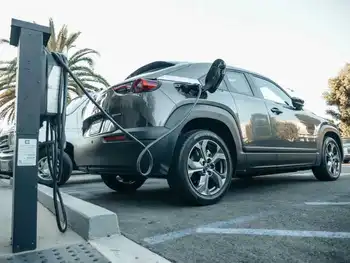
The Age of Electric Cars Is Dawning Ahead of Schedule
EV Price Parity is nearing reality in Europe as subsidies, falling battery costs, higher energy…
View more
Hydro One Networks Inc. - Ivy, ONroute and Canadian Tire make it easy to charge your next road trip
ONroute EV Charging Stations now live on Ontario's Highways 401 and 400, powered by Ivy…
View more
The N.L. government is pushing the electric car but Labrador's infrastructure is lagging behind
Labrador EV Charging Infrastructure faces gaps, with few fast chargers; Level 2 dominates, fueling range…
View more
Use of electric vehicles associated with fewer asthma-related ER visits on a local level, study shows
Electric Vehicle Adoption Benefits include reduced air pollution, lower greenhouse gas emissions, and improved respiratory…
View more
Sign Up for Electricity Forum’s Newsletter
Stay informed with our FREE Newsletter — get the latest news, breakthrough technologies, and expert insights, delivered straight to your inbox.
Electricity Today T&D Magazine Subscribe for FREE

Stay informed with the latest T&D policies and technologies.
- Timely insights from industry experts
- Practical solutions T&D engineers
- Free access to every issue

