Power Factor Calculator for Three Phase kVAR
By R.W. Hurst, Editor
By R.W. Hurst, Editor

Our customized live online or in‑person group training can be delivered to your staff at your location.


Power factor calculator models three phase kVAR using real power, apparent power, and line to line voltage to evaluate reactive demand, utility penalty exposure, and capacitor sizing limits in industrial ac circuits.
Power factor calculator determines whether reactive demand is eroding transformer margin, elevating line current, or reducing available feeder capacity under measured kW load. By separating real and reactive components through the power factor formula, it exposes the volt amperes reactive that must be offset to maintain operational stability.
In balanced systems supplying motors and other inductive load conditions, declining power factor expands apparent power without increasing useful output. The result is higher current flow for the same production level, increasing copper losses and reducing thermal headroom across conductors and buswork.
As the ratio of real power to apparent power declines, current rises proportionally. That rise increases I²R losses, elevates conductor temperature, and narrows protection margin, accelerating equipment stress under sustained load.
The decision boundary is not abstract efficiency. It is whether reactive burden has reached a threshold that threatens compliance limits, system capacity, or protection coordination within the facility’s operating envelope.
A power factor calculator translates measured kW load and line to line voltage into reactive demand expressed in kVAR. In a three phase system, real power remains constant while apparent power expands as the phase angle between voltage and current increases. That expansion directly increases line current.
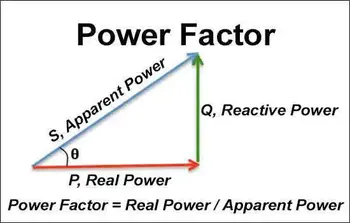
The governing relationship is expressed through the power factor formula:
Required kVAR = kW (tan θ? − tan θ?)
Stay informed with our FREE Power Quality Newsletter — get the latest news, breakthrough technologies, and expert insights, delivered straight to your inbox.
θ? represents the present phase angle derived from measured PF. θ? represents the target PF boundary. The calculator uses this relationship to determine how many volt amperes reactive must be compensated to move from existing conditions to a defined operating threshold.
This modeling differs from the conceptual explanation found in power factor. Here, the objective is not definition but quantification of corrective magnitude.
Most industrial metering reports displacement PF, derived from the fundamental frequency relationship in an ac circuit. However, facilities with nonlinear loads experience distortion components that inflate RMS current without contributing useful torque or heating output.
Where harmonic content is significant, apparent power increases because harmonic currents add to the total magnitude. The calculator, therefore, must be interpreted alongside harmonic data described in power quality and harmonics. A facility reporting 0.96 displacement PF may still exhibit elevated true current due to distortion.
This operational edge case becomes critical when capacitor banks are introduced without harmonic evaluation, potentially amplifying the risk of resonance.
At constant real power, declining PF increases line current proportionally. A 1,500 kW load operating at 0.82 PF draws approximately 1,829 kVA. Raising PF to 0.95 reduces apparent power to roughly 1,579 kVA, reducing line current by more than 13%.
That reduction directly lowers conductor heating and restores transformer capacity. In systems evaluated using three phase power calculation, current reduction translates into measurable headroom for additional load or improved voltage stability.
If left uncorrected, the cascading consequence emerges. Increased current raises copper losses. Elevated temperature increases resistance. Higher resistance compounds the voltage drop and narrows the protection margin. What begins as reactive inefficiency evolves into a capacity constraint and thermal stress.
Utilities commonly enforce billing adjustments below defined PF thresholds, often 0.90 or 0.95. A power factor calculator clarifies whether the facility is operating within a safe margin or drifting toward penalty exposure.
For example, a 1 MW facility at 0.88 PF requires approximately 480 kVAR to reach 0.95. Without correction, elevated reactive demand may increase demand charges and distort apparent capacity planning.
Accurate modeling depends on reliable measurements obtained through structured power quality analysis. Using nameplate data rather than measured load introduces an error that undermines correction sizing accuracy.
Think you know Power Quality? Take our quick, interactive quiz and test your knowledge in minutes.
In OT governed industrial systems, this is a capacity management discipline. Accurate modeling ensures that compensation reduces current, restores thermal margin, and protects against penalty exposure without introducing overcorrection instability or harmonic resonance.
Explore 50+ live, expert-led electrical training courses –