NFPA 70b Training - Electrical Maintenance
Our customized live online or in‑person group training can be delivered to your staff at your location.

- Live Online
- 12 hours Instructor-led
- Group Training Available
Regular Price:
$699
Coupon Price:
$599
BERLIN
—
ABB Terra 360 EV Charger offers 360 kW DC fast charging, ultra-fast top-ups, and multi-vehicle capability for Ionity, Electrify America, and depot installations, adding 100 km in under 3 minutes with compact footprint.
The Situation Explained
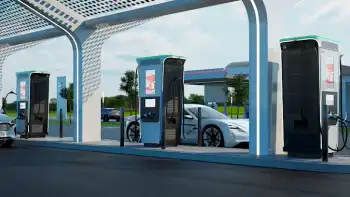
ABB's Terra 360 is a 360 kW DC fast charger for EVs, powering up to four vehicles simultaneously with a compact footprint.
360 kW DC fast charging with dynamic power distribution.
Supports simultaneous charging of up to four EVs.
Delivers ~100 km of range in under three minutes.
Compact footprint for dense depots and public lots.
Swiss company ABB, which supplies EV chargers to Ionity and Electrify America amid intensifying charging network competition worldwide, has unveiled what it calls the "world's fastest electric car charger." As its name suggests, the Terra 360 has a 360 kW capacity, and as electric-car adoption accelerates, it could fully charge a (theoretical) EV in 15 minutes. More realistically, it can charge four vehicles simultaneously, saving space at charging stations.
The Terra 360 isn't the most powerful charger by much, as companies like Electrify America, Ionity and EVGo have been using 350 kW chargers manufactured by ABB and others since at least 2018. However, it's the "only charger designed explicitly to charge up to four vehicles at once," the company said. "This gives owners the flexibility to charge up to four vehicles overnight or to give a quick refill to their EVs in the day." They also have a relatively small footprint, allowing installation in small depots or parking lots, helping as US automakers plan 30,000 new chargers nationwide.
There aren't a lot of EVs that can handle that kind of charge. The only two approaching it are Porsche's Taycan, with 270 kW of charging capacity and the new Lucid Air, which allows for up to 300 kW fast-charging. Tesla's Model 3 and Model Y EVs can charge at up to 250 kW, while Hyundai's Ioniq 5 is rated for 232 kW DC fast charging in optimal conditions.
Such high charging levels aren't necessarily great for an EV's battery, and the broader grid capacity question looms as the American EV boom gathers pace. Porsche, for instance, has a battery preservation setting on its Plug & Charge Taycan feature that lowers power to 200 kW from the maximum 270 kW allowed — so it's essentially acknowledging that faster charging degrades the battery. On top of that, extreme charging levels don't necessarily save you much time, as Car and Driver found. Tesla recently promised to upgrade its own Supercharger V3 network from 250kW to 300kW, with energy storage solutions emerging to buffer high-power sites.
ABB's new chargers will be able to add 100 km (62 miles) of range in less than three minutes. They'll arrive in Europe by the end of the year and start rolling out in the US and elsewhere in 2022.
Related News
Related News
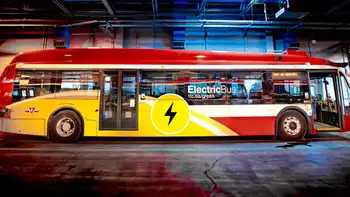
What cities can learn from the biggest battery-powered electric bus fleet in North America
Canadian Electric Bus Fleet leads North America as Toronto's TTC deploys 59 battery-electric, zero-emission buses,…
View more
Electric cars won't solve our pollution problems – Britain needs a total transport rethink
UK Transport Policy Overhaul signals bans on petrol and diesel cars, rail franchising reform, 15-minute…
View more

Scrapping coal-fired electricity costly, ineffective, says report
Canada Coal Phase-Out Costs highlight Fraser Institute findings on renewable energy, wind and solar integration,…
View more
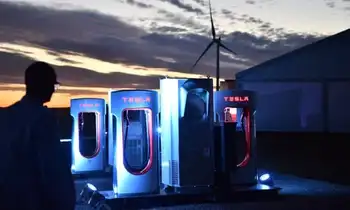
Elon Musk says cheaper, more powerful electric vehicle batteries are 3 years off
Tesla Battery Day Innovations detail larger cylindrical EV cells with higher energy density, greater power,…
View more
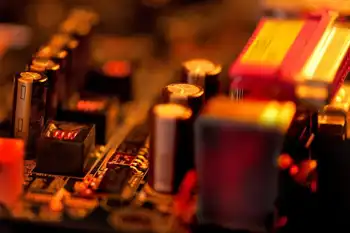
This Thin-Film Turns Heat Waste From Electronics Into Electricity
Pyroelectric Energy Harvesting captures low-grade heat via thin-film materials, converting temperature fluctuations into power for…
View more
Hydro One Networks Inc. - Ivy, ONroute and Canadian Tire make it easy to charge your next road trip
ONroute EV Charging Stations now live on Ontario's Highways 401 and 400, powered by Ivy…
View more
Sign Up for Electricity Forum’s Newsletter
Stay informed with our FREE Newsletter — get the latest news, breakthrough technologies, and expert insights, delivered straight to your inbox.
Electricity Today T&D Magazine Subscribe for FREE

Stay informed with the latest T&D policies and technologies.
- Timely insights from industry experts
- Practical solutions T&D engineers
- Free access to every issue
